Untargeted Metabolomics

Untargeted Metabolomics Plus — Discover First, Understand Later

No predefined targets — full-spectrum scanning of metabolic changes in your samples, ideal for exploratory research, phenotyping and biomarker discovery. Polarity-switching acquisition plus dual matching against public and in-house libraries covers both polar and non-polar metabolites in blood, tissue, cell, urine and other matrices. Powered by Q Exactive HF-X with deep analysis extended to 9 modules.

Q Exactive HF-X
High-Resolution MS Platform
HIGH-RESOLUTION MS
9
Analysis Modules
ANALYSIS MODULES
10,000+
Metabolic Features
METABOLIC FEATURES

Technical Specifications

TECHNICAL SPECIFICATIONS
ItemDetails
PlatformQ Exactive HF-X high-resolution MS · polarity-switching acquisition
Identification StrategyDual matching against public databases and in-house libraries, covering polar and non-polar metabolites
Applicable MatricesBlood (serum/plasma) · tissue · cells · urine and other matrices
Differential ScreeningDefault FC ≥ 1.5 and p < 0.05; or VIP ≥ 1 and q ≤ 0.05 (strategy auto-selected based on permutation-test results)

Analysis Workflow

ANALYSIS WORKFLOW
1
Data Preprocessing
Peak picking · alignment · normalization
2
Quality Control
PCA · QC correlation
3
Univariate Stats
FC · t-test / Wilcoxon
4
Multivariate Stats
OPLS-DA · permutation test
5
Differential Screening
FC + p or VIP + q
6
Abundance Analysis
Clustering · correlation · Z-score
7
Functional annotation
KEGG · HMDB / SMPDB
8
Biomarkers & Disease
ROC · AUC · Venn
Workflow: consultation (goals / study design) → proposal & quote (timeline / agreement) → sample intake (cold chain / pre-check / labeling) → experiment (acquisition / QC) → delivery (data + report + interpretation).

Bioinformatics Analyses (9 Modules)

BIOINFORMATIC MODULES
ModuleCore Methods & MetricsKey Outputs
Data PreprocessingPeak picking, retention-time correction and alignment in Compound Discoverer; TIC normalization, missing-value filtering and imputation, Pareto scalingMetabolic-feature quantification matrix
Quality ControlGlobal PCA / PLS-DA, QC-sample correlations (generally > 0.99) and pairs plots, sample-intensity boxplots, HMDB level-3 classification statisticsQC figure sets, classification statistics tables
Univariate StatsFold change; Welch's t-test / Wilcoxon test; BH-adjusted p-values (padj)Volcano plots, classified volcano plots, full metabolite statistics tables
Multivariate StatsPCA / PLS-DA / OPLS-DA modeling; 200 permutation tests; VIP score calculationScore plots, permutation-test plots, VIP Top-25 bar charts
Differential ScreeningDefault FC ≥ 1.5 and p < 0.05; or VIP ≥ 1 and q ≤ 0.05 (strategy auto-selected based on permutation-test results)Differential metabolite lists, up/down-regulation counts
Abundance AnalysisHierarchical clustering; complex heatmap of top-50 significant metabolites; abundance analysis; Spearman correlation; Z-score normalizationCluster heatmaps, correlation plots, abundance plots
Functional annotationKEGG level 1–3 annotation and enrichment; Sankey diagrams, differential abundance score (DA Score), pathway-impact topology analysis, chord / donut plots / regulatory networksKEGG enrichment figure sets and result tables
HMDB / SMPDBHMDB and SMPDB enrichment; single-metabolite pathway analysis; pathway–metabolite networksSMPDB enrichment figure sets and result tables
Disease & BiomarkersMetabolite–disease association enrichment; ROC curves and AUC ranking; Venn overlap analysis of differential metabolites for multi-group comparisonsROC plots, AUC ranking tables, Venn diagrams

Example Results

SELECTED FIGURES FROM ACTUAL REPORTS
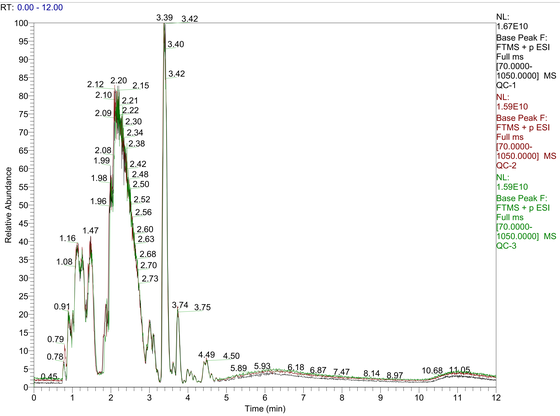
Total Ion Chromatogram (TIC)
One chromatogram per polarity mode showing base-peak overlap of QCs and all samples, assessing chromatographic separation and instrument-response stability.
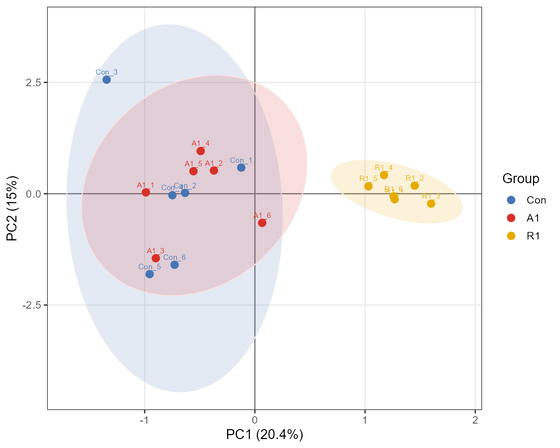
Global PCA
Global PCA
All samples including QCs projected together; tight QC clustering indicates a stable system, while clear group separation indicates distinct metabolic profiles.
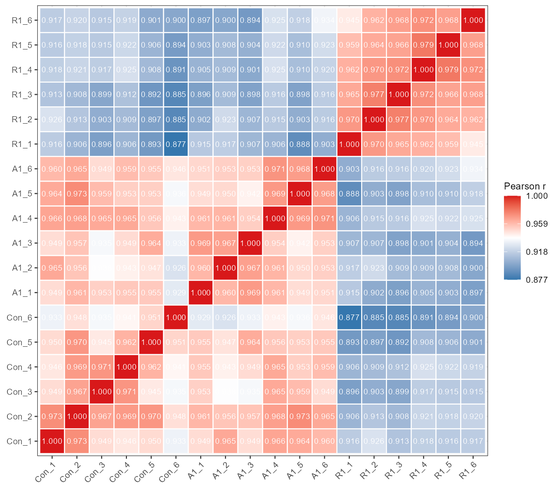
QC Sample Correlation
Pairwise Pearson correlation heatmap of QC samples; values generally > 0.99 indicate reliable, batch-comparable data.
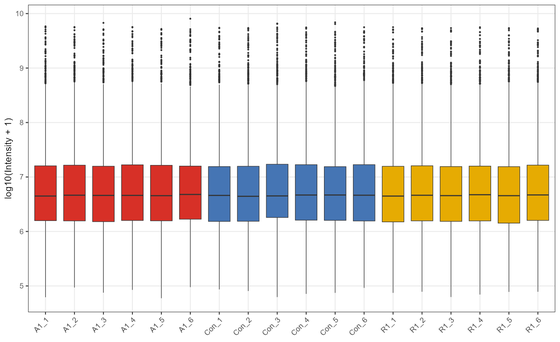
Sample Intensity Boxplot
Comparison of metabolite intensity distributions across groups, revealing outliers and normalization quality.
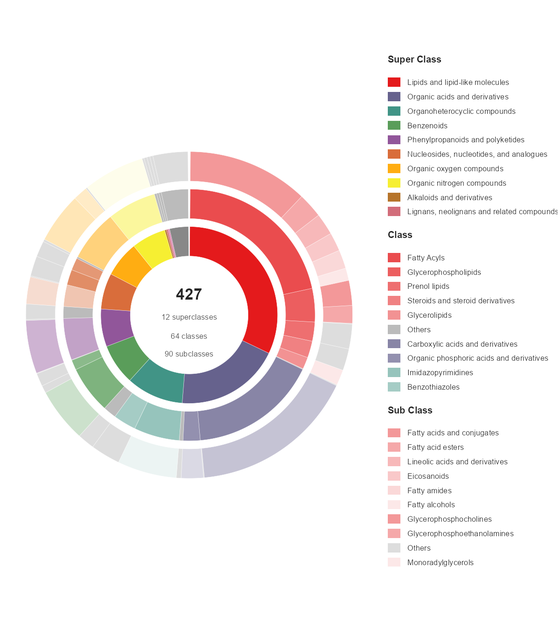
Metabolite Classification Donut
Composition of identified metabolites by HMDB Super Class, profiling the chemical classes of the dataset.
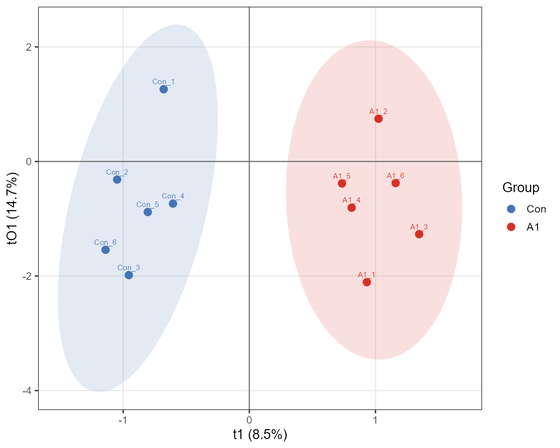
OPLS-DA Score Plot
OPLS-DA Score Plot
Clearer separation after orthogonal signal correction, used to screen the most discriminating metabolites between groups.
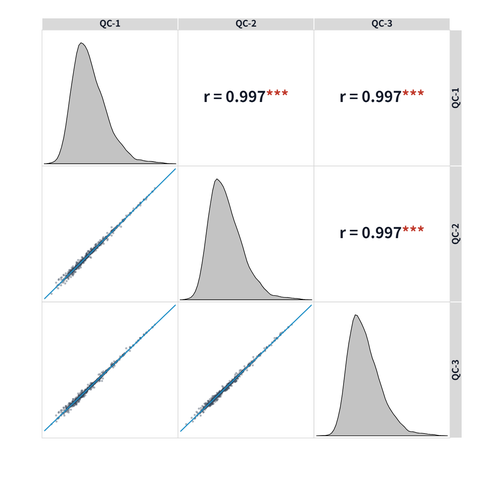
QC Correlation Pairs Plot
Pairwise scatter, distribution and correlation coefficients of QC samples, assessing injection stability and data reproducibility.
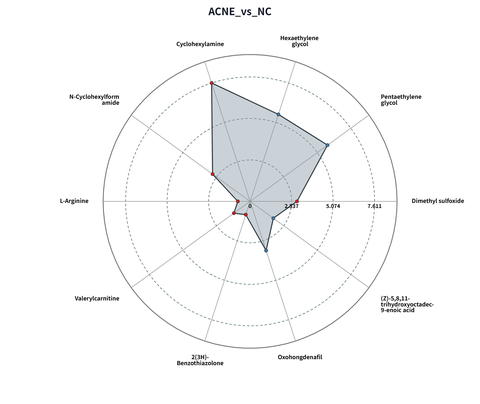
Differential Metabolite Radar Chart
Radar chart of fold changes for differential metabolites, intuitively comparing magnitude and pattern of changes across groups.
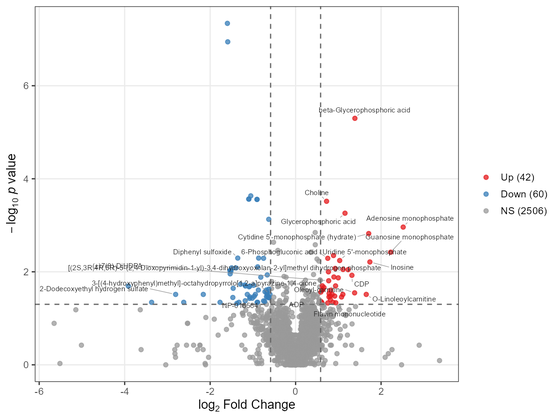
Volcano Plot
Volcano Plot
log2(FC) on the x-axis and −log10(P) on the y-axis, presenting fold change and statistical significance together.
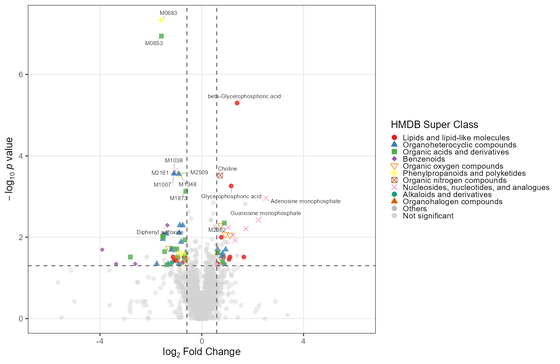
Volcano Plot (Classified)
Colored by HMDB chemical superclass, with the top-15 most significant known differential metabolites labeled.
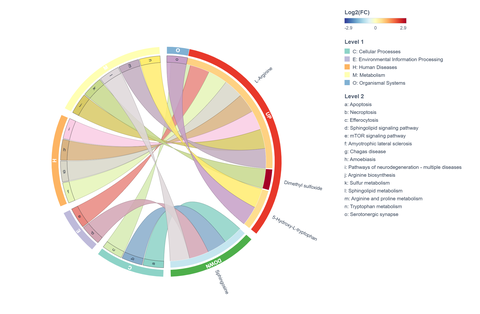
Significant Pathway Chord Diagram
Mapping between differential metabolites and significant pathways (Level 1 / Level 2), colored by regulation direction and log2(FC).
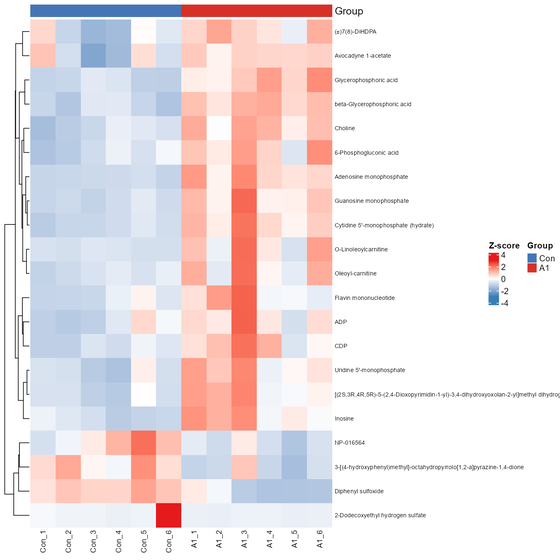
Hierarchical Clustering Heatmap
Rows are metabolites and columns are samples — red high, blue low; dendrograms show clustering, revealing intergroup patterns and within-group reproducibility.

Applications

APPLICATIONS
Disease Biomarker DiscoveryDrug Mechanism & EfficacyNutrition & PhenotypingPlant / Microbial MetabolismToxicology & Exposure Assessment

FAQ

FAQ
How long does a Untargeted Metabolomics project take?
Mature targeted panels typically take 1-3 weeks; untargeted projects take 2-4 weeks (counted from sample receipt and QC approval). The exact timeline is confirmed in writing before project start, and progress is trackable on the OmicsHub cloud platform.
What if my sample amount is below the recommendation?
Please do not dilute your samples. Low-input samples can often be accommodated by adjusting the preparation workflow — tell us the actual amount and our technical team will assess feasibility and note adjustments in the study plan.
Can I add targets to an existing panel?
Yes. Mature panels support on-demand additions; novel analytes outside the list can be implemented through custom method development (requires standards and extra validation time) — see our Custom Targeted Metabolomics service.
What samples do you need for Untargeted Metabolomics?
Serum/plasma ≥100 μL (fasting, no haemolysis), tissue ≥50 mg (snap-frozen), cells ≥1×10⁶ (medium washed off), urine ≥200 μL. Keep fasting time consistent, aliquot into single-use volumes and avoid freeze–thaw. Full guidance: Technical Resources → Sample Guide.

Delivery timing: sample shipping, customs declaration and similar steps may extend turnaround; actual project timelines prevail.

Request a Quote or Study Design

Tell us about your project — we reply within one business day (free assessment)

Used only for this enquiry; never shared.

Start Your Multi-omics Project

Free study design · Interactive execution · In-depth data interpretation

Official Channels
OFFICIAL CHANNELS
WeChat Official Account QR
Official Account
WECHAT OFFICIAL ACCOUNT
WeChat QR
WeChat Service
CUSTOMER SERVICE
Xiaohongshu QR
Xiaohongshu
XIAOHONGSHU
Call us:400-660-8826
WeChat QR
Scan to chat on WeChat