| Module | Core Methods & Metrics | Key Outputs |
|---|---|---|
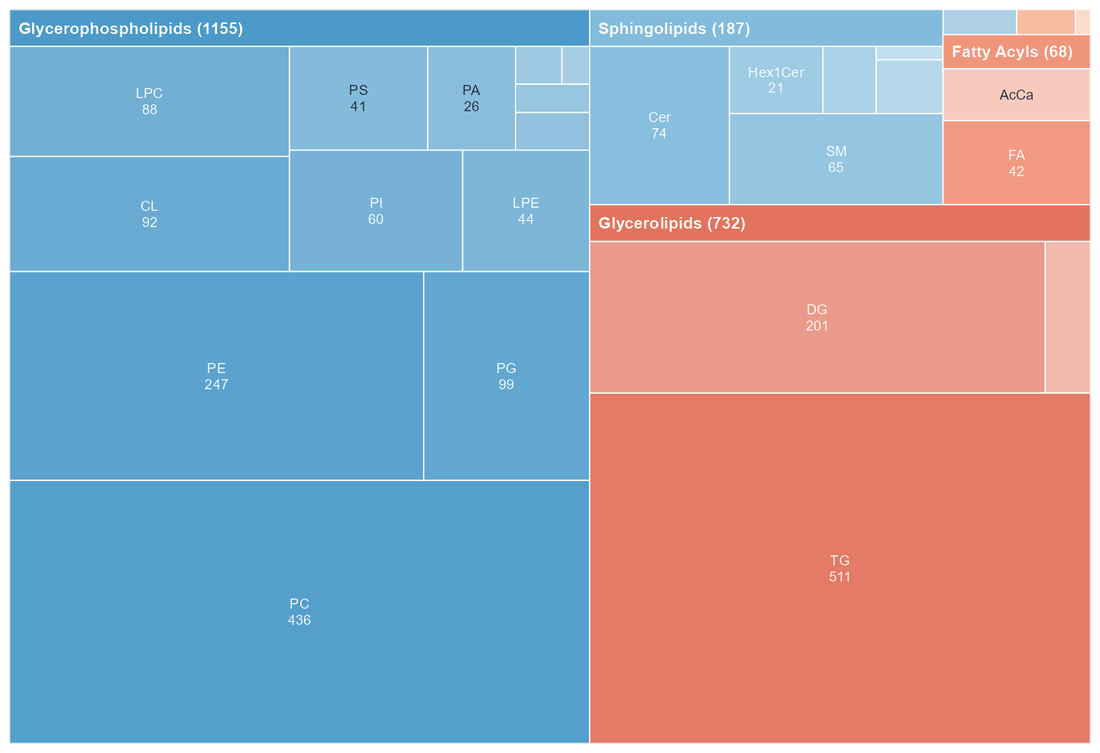
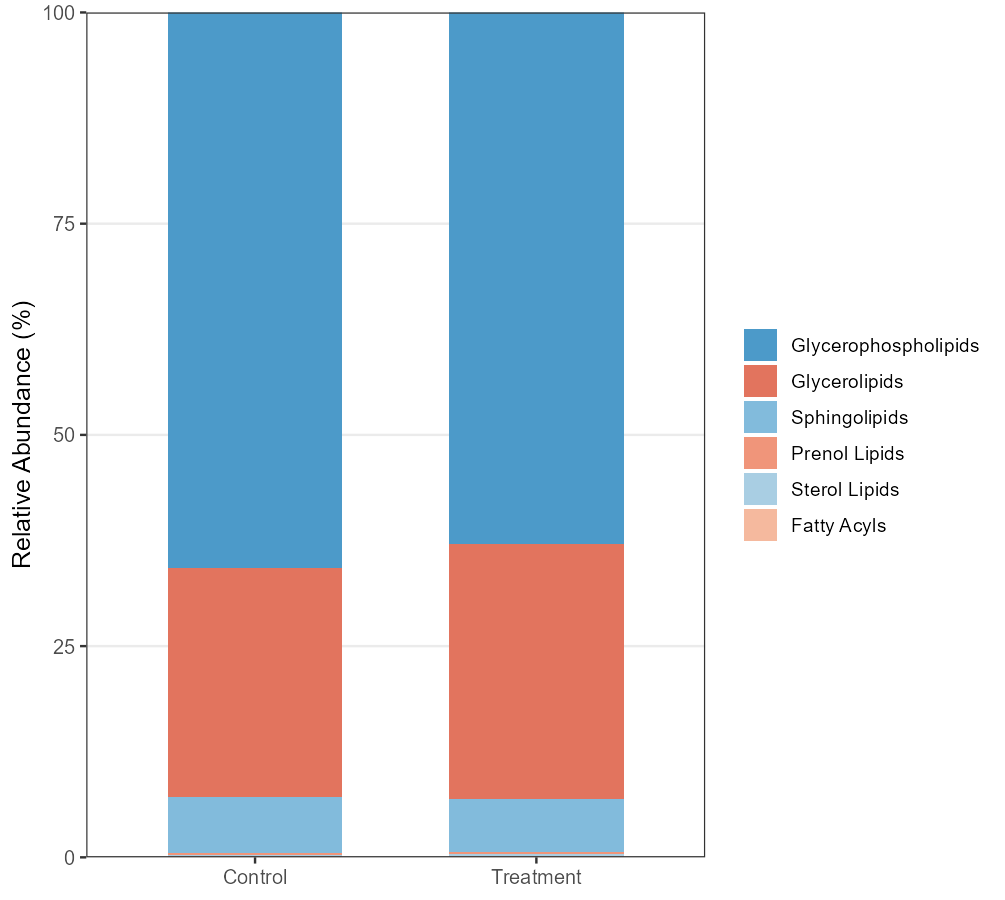
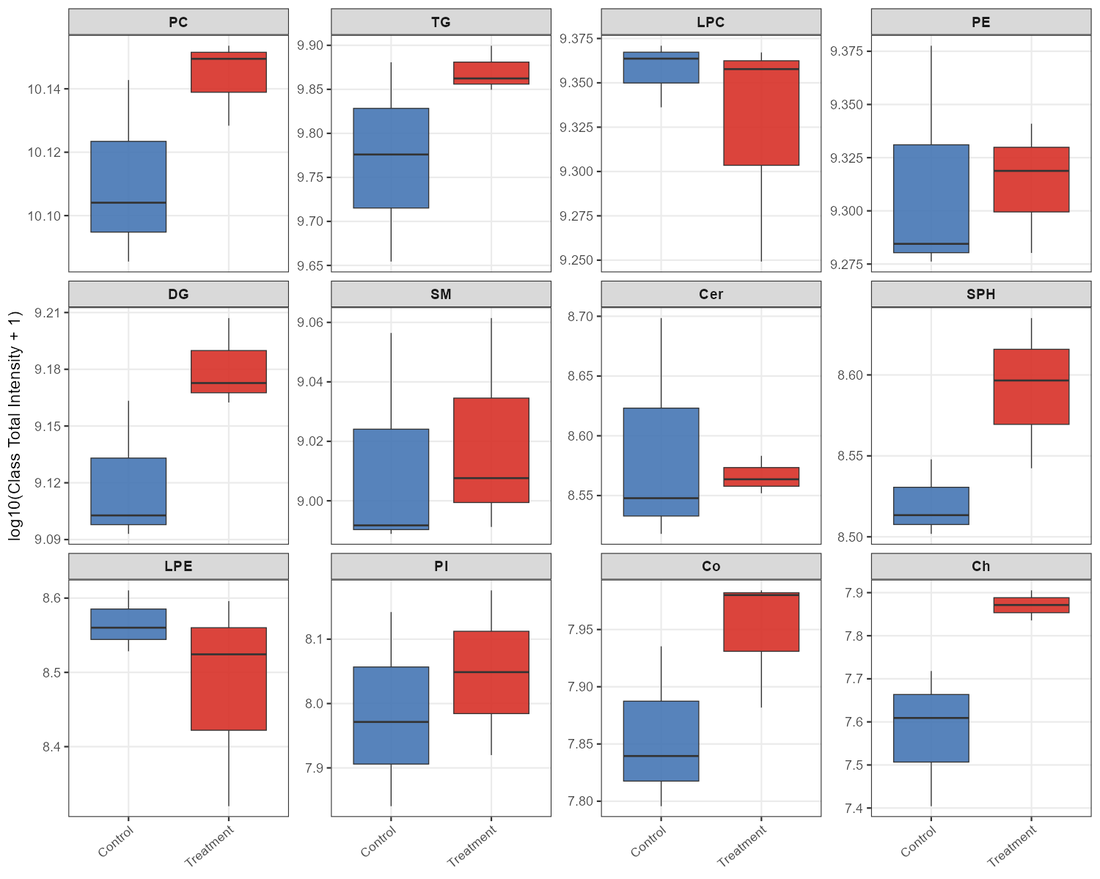
| Lipid Composition | Hierarchical treemap of lipid classes (main class → subclass); stacked bar charts of relative class abundance per group; intergroup boxplots of the top-12 lipid classes with differential tests | Classification treemaps, stacked abundance plots, boxplots, class statistics tables |
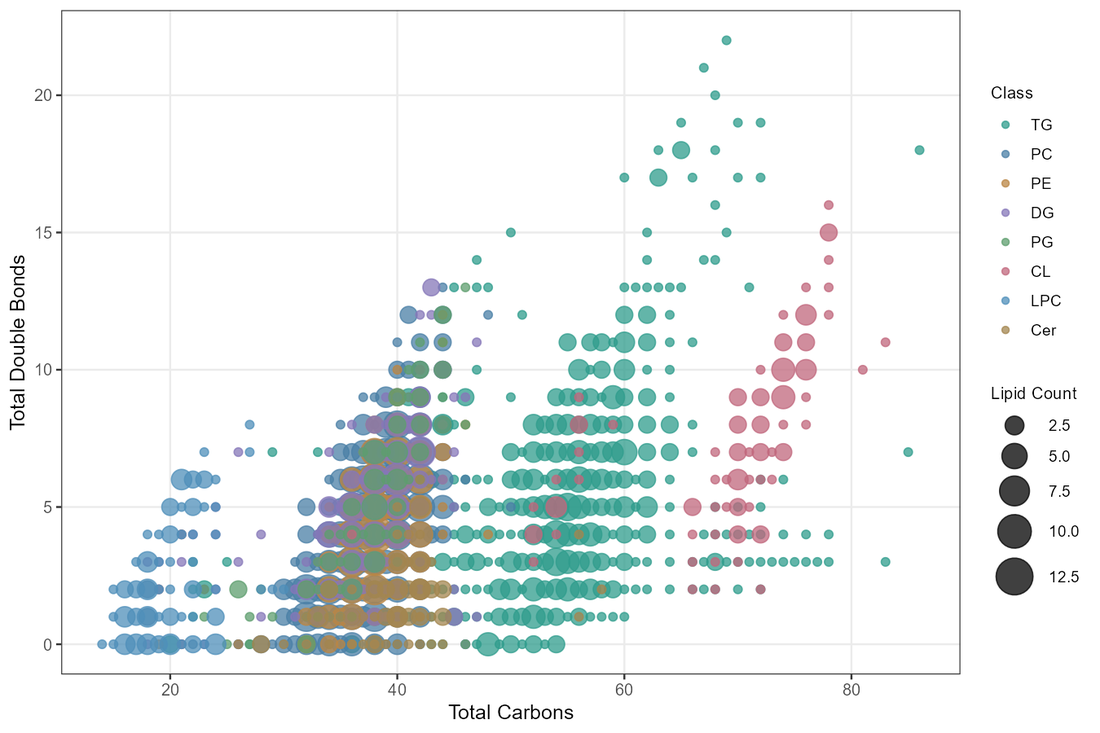
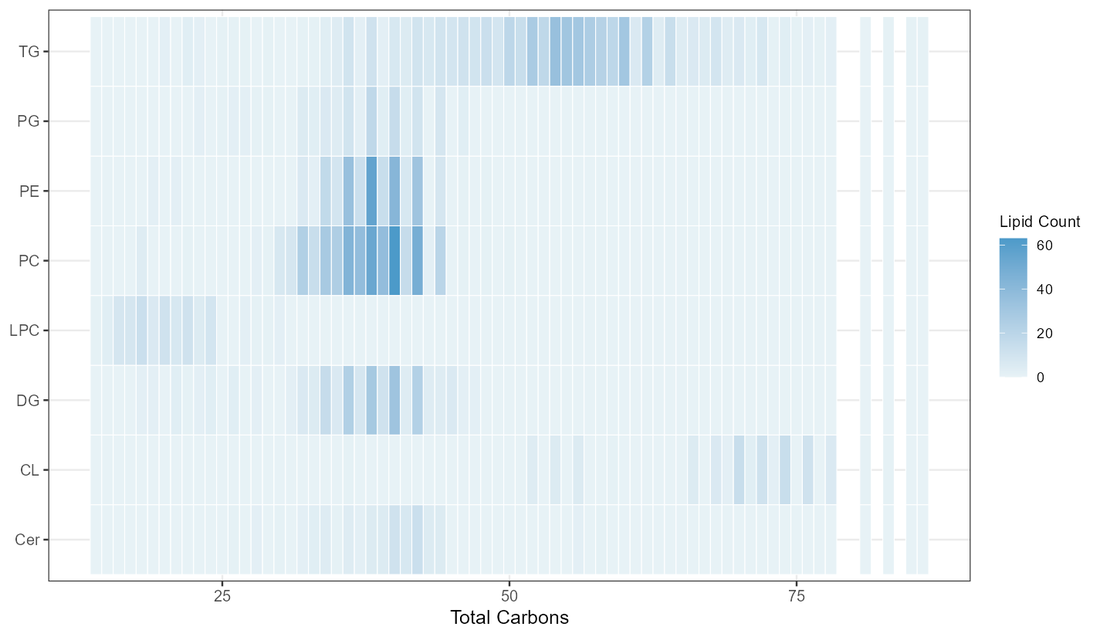
| Carbon-Chain Structure | Bubble plots of chain length vs. unsaturation; count heatmaps of major lipid classes × total carbon number; stacked bar charts of saturation composition for major classes | Chain bubble plots, count heatmaps, saturation composition plots and statistics tables |
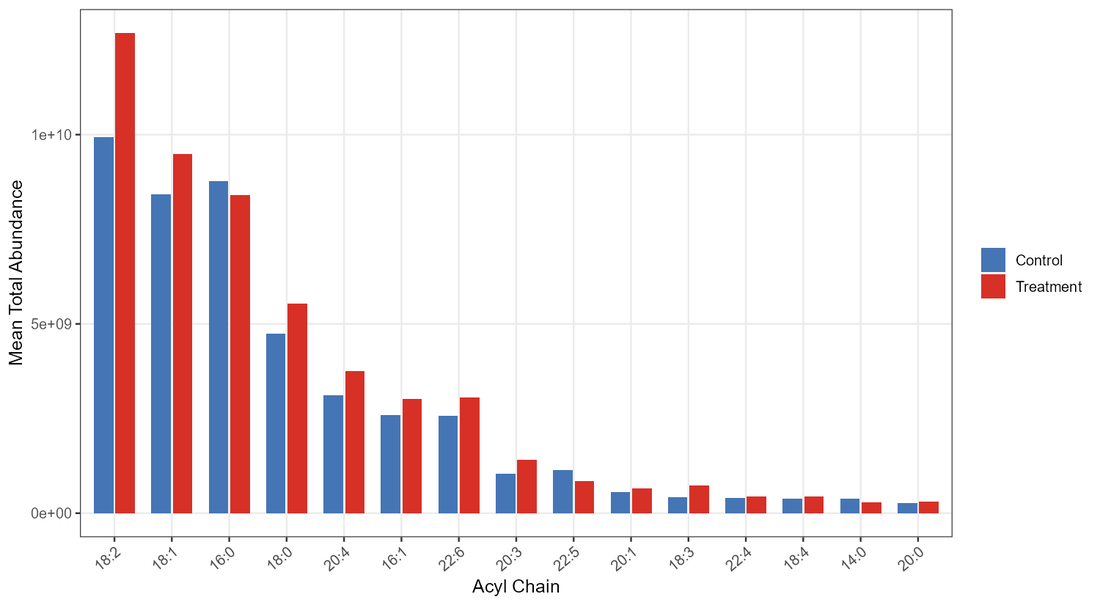
| Acyl Chains & Ether Lipids | Acyl-chain composition analysis (Top 15); class-distribution analysis of ether lipids (O- / P-) | Acyl-chain bar charts, ether-lipid distribution plots and statistics tables |
| Differential Lipid Screening | Volcano plots and class-colored versions; FC + p threshold screening; strategy auto-switches between VIP + P and FC + P based on permutation-test results | Volcano plots (incl. classified), differential lipid lists |
| Differential Lipid Abundance | Hierarchical clustering; complex heatmap of top-50 significant lipids; abundance analysis; correlation and Z-score analyses of top-10 up/down-regulated lipids | Cluster heatmaps, complex heatmaps, correlation and Z-score plots |
| Lipid Class Enrichment | Fisher's exact test answers whether differential lipids concentrate in specific classes; carbon-chain distribution comparison of differential lipids | Enrichment result tables, chain-distribution comparison plots |
| Biomarker Screening | Per-lipid ROC curves and AUC ranking to assess diagnostic/subtyping performance (performed when each group has ≥5 samples); Venn diagrams of differential lipids across comparisons | ROC plots, AUC ranking tables, Venn diagrams |
| Nomenclature & Data Tables | Cross-reference of lipid class abbreviations and full names; explanation of the "carbon number : double-bond number" nomenclature | Classification cross-reference tables, full lipid statistics and screening result tables |
Delivery timing: sample shipping, customs declaration and similar steps may extend turnaround; actual project timelines prevail.
Tell us about your project — we reply within one business day (free assessment)
Free study design · Interactive execution · In-depth data interpretation