EXPOSOMICS

Environmental Exposomics

Exposomics — Quantitative Profiling of Chemical Exposure

A targeted quantification strategy to assess body burden and biological response to exogenous chemicals — pesticides, pharmaceuticals, industrial/environmental pollutants and lifestyle exposants. Absolute quantification against a 639-compound standards library on AB Sciex QTRAP 6500+ / 7500+ dual platforms, with limits of detection down to 0.002 ng/mL. Custom analyses including exposure–disease association, mixture joint effects and population stratification are supported, with full QC evaluation and statistics delivered with the report.

639
Target Compounds Quantified
TARGET COMPOUNDS
6
Target Categories
TARGET CLASSES
0.002 ng/mL
Limit of Detection
LIMIT OF DETECTION

Technical Specifications

TECHNICAL SPECIFICATIONS
ItemDetails
PlatformAB Sciex QTRAP 6500+ / 7500+ dual platforms
QuantificationAbsolute quantification against a 639-compound standards library; LOD down to 0.002 ng/mL
QCTotal ion chromatograms (TIC); RSD distribution in QCs and QC-sample correlations (generally > 0.99); internal standards and calibration curves applied throughout
Custom AnalysesMultivariate association of exposure levels with region / age / BMI / clinical indicators; intergroup comparison and population stratification
Mixture Joint EffectsWQS (weighted quantile sum regression) · BKMR (Bayesian kernel machine regression) · q-gcomp (quantile g-computation)

Analysis Workflow

ANALYSIS WORKFLOW
1
Data Preprocessing
Curation · comparison plan
2
Quality Control
TIC · RSD · QC correlation
3
Detection Statistics
Category statistics · clustering
4
Multivariate Stats
PCA / OPLS-DA modeling
5
Differential Screening
Volcano · Z-score
6
Distribution Analysis
Cluster heatmap · violin plots
7
Custom Association
Age / BMI / clinical indicators
8
Mixture Joint Effects
WQS / BKMR regression models
Analysis deliverables: full QC evaluation and statistical analyses delivered with the report, including the master quantification table, group-comparison plan, differential exposure list, association and joint-effect result tables, and all raw figure files.

Target List — 6 Categories, 639 Compounds

TARGET PANEL 2026
CategoryCoverageRepresentative Compounds
Pesticides353Chlorpyrifos, imidacloprid, atrazine, fipronil, spinosad A, etc.; 71 subcategories including 50 organophosphate insecticides, 28 triazole fungicides and 23 triazine herbicides
Human Pharmaceuticals110Ibuprofen, sildenafil, nifedipine, carbamazepine, oseltamivir, etc.; 21 subcategories including 14 β2-agonists, 12 hypoglycemics and 12 antihistamines
Industrial / Environmental Pollutants97PFOA, PFOS, bisphenol A, rhodamine B, etc.; 7 subcategories including 23 phthalates, 22 perfluorinated compounds and 21 phenolic pollutants
Human / Veterinary Drugs35Azithromycin, sulfamethoxazole, progesterone, albendazole, ractopamine, etc.; 9 subcategories including 6 sex hormones, 6 NSAIDs and 6 antibiotics
Veterinary Drugs24Fenbendazole, florfenicol, flumequine, nicarbazin, chloramphenicol, etc.; 10 subcategories including 7 anthelmintics, 4 quinolones and 3 anticoccidials
Lifestyle Exposants20Nicotine, DEET, sucralose, triclocarban, 2-ethylhexyl salicylate, etc.; 4 subcategories including 13 cosmetics and 5 food additives

Bioinformatics Analyses

BIOINFORMATIC MODULES
ModuleCore Methods & Key Outputs
Data PreprocessingProject data curation and exposure quantification matrix construction; group-comparison plan (single-group baseline / two-group comparison / multi-group stratification) — master quantification table
Quality ControlTotal ion chromatograms (TIC); RSD distribution and QC-sample correlations (generally > 0.99); internal standards and calibration curves throughout — TIC plots, RSD distribution plots
Detection StatisticsDetection counts and rates by compound category; exposure clustering and concentration distribution — detection statistics tables, cluster plots, violin plots
Multivariate StatsPCA for group separation and outlier inspection; OPLS-DA discriminant modeling with 200 permutation tests — score plots, permutation-test plots
Differential Exposure ScreeningFold change combined with p/q values to screen up- and down-regulated exposures — volcano plots, Z-score plots, differential exposure lists
Differential Exposure AnalysisHierarchical clustering, boxplots, lollipop charts and Spearman correlation analysis — cluster heatmaps, boxplots, lollipop charts
Custom Association AnalysisMultivariate association of exposure with region / age / BMI / clinical indicators; population stratification — stratified violin plots, forest plots
Mixture Joint EffectsWQS regression; BKMR; quantile g-computation — WQS weight plots, BKMR figure sets

Example Results

SELECTED FIGURES FROM ACTUAL REPORTS
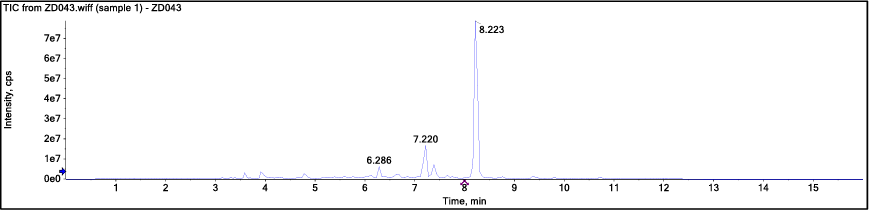
Total Ion Chromatogram (TIC)
Single-sample total ion chromatogram for assessing chromatographic separation and instrument response.
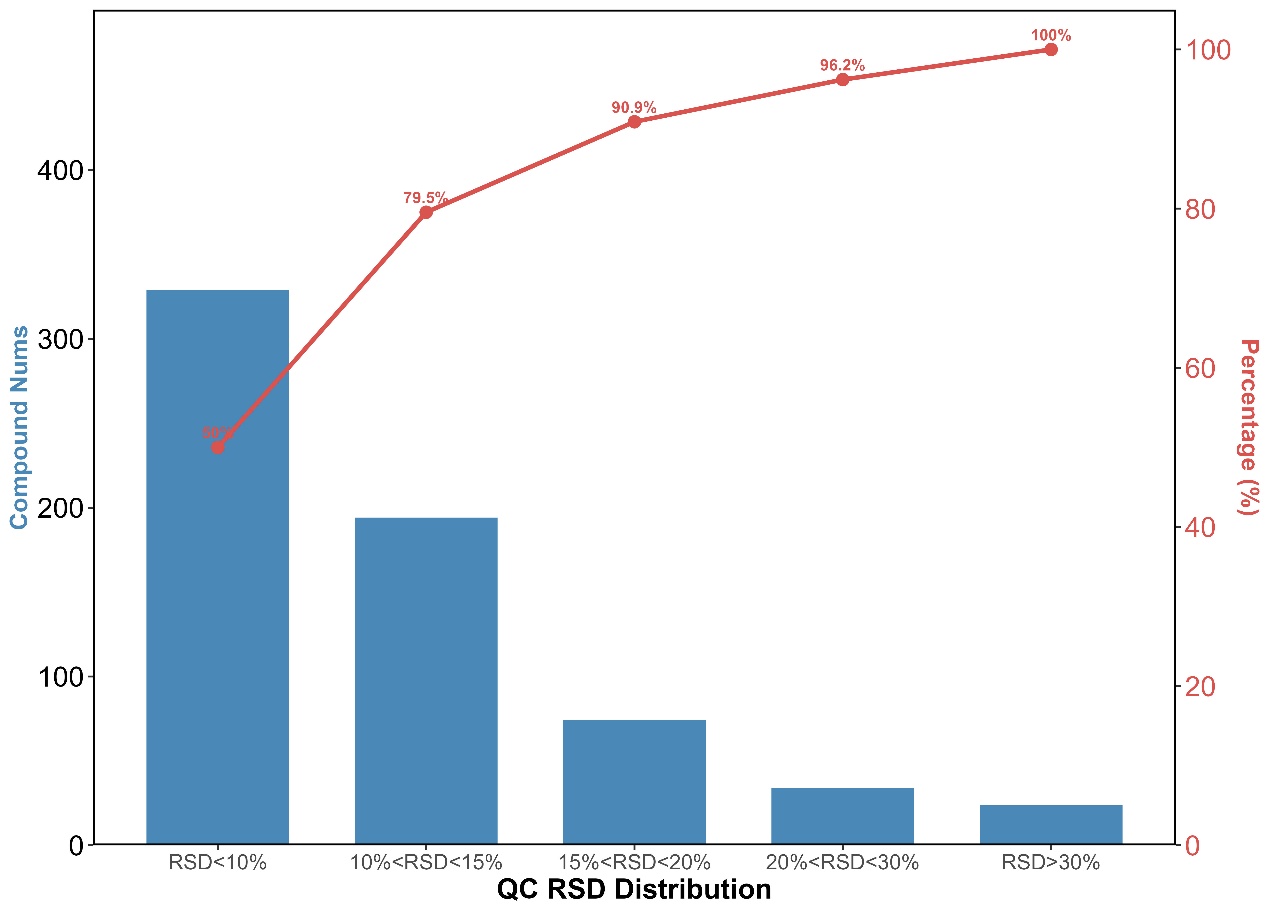
QC Sample RSD Distribution
RSD distribution and cumulative percentage of targets in QCs — 79.5% of compounds show RSD < 15%, indicating good reproducibility.
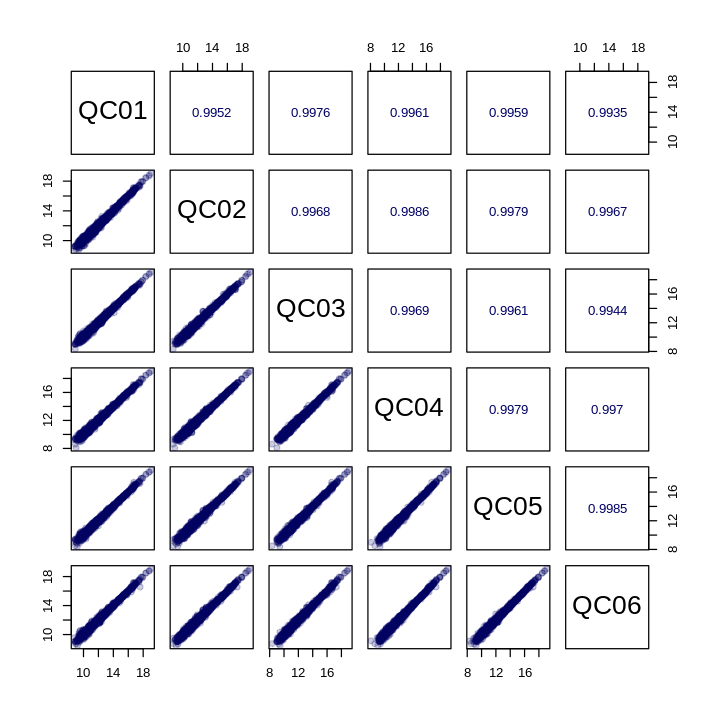
QC Sample Correlation Pairs Plot
Pairwise Pearson correlations among QC samples generally exceed 0.99, demonstrating system stability and data reliability.
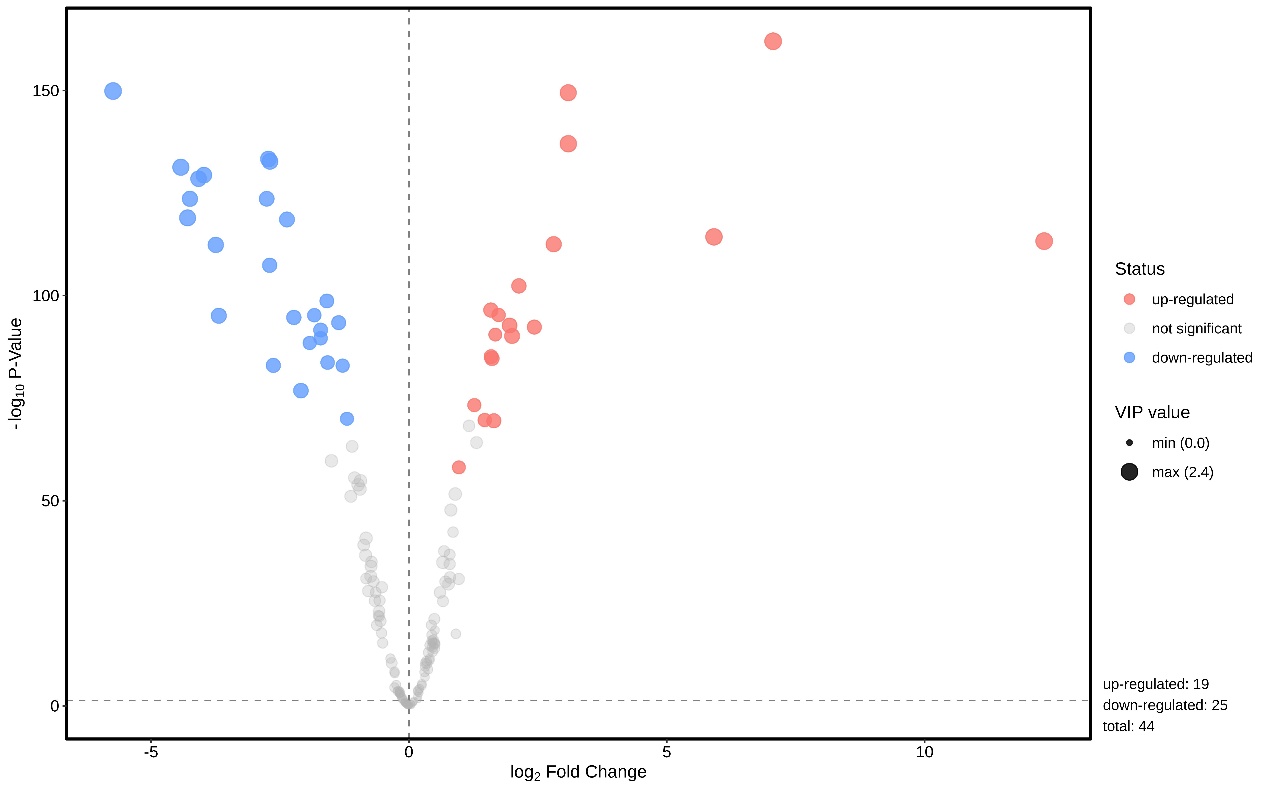
Differential Exposure Volcano Plot
Dual thresholds of log2(FC) and −log10(P) mark up/down-regulated exposures; bubble size maps VIP values.
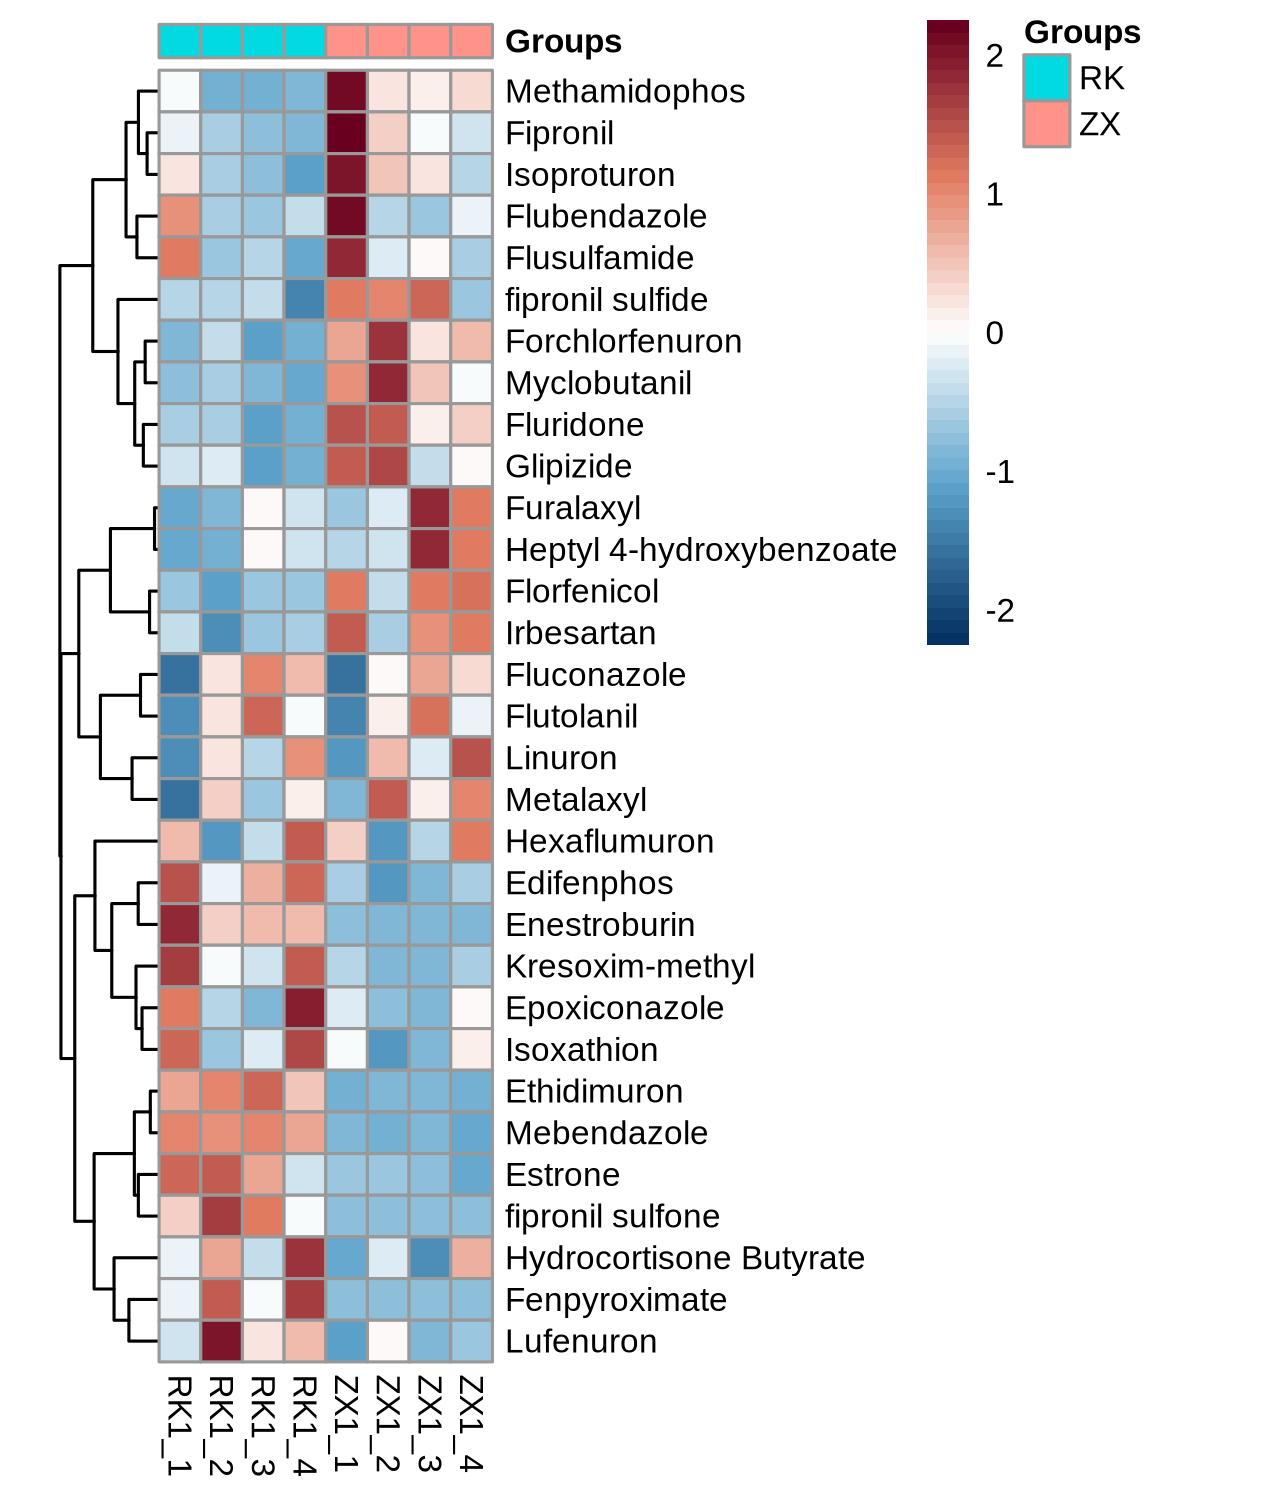
Intergroup Hierarchical Clustering Heatmap
Top differential exposures clustered by sample, visualizing exposure-profile differences between groups.
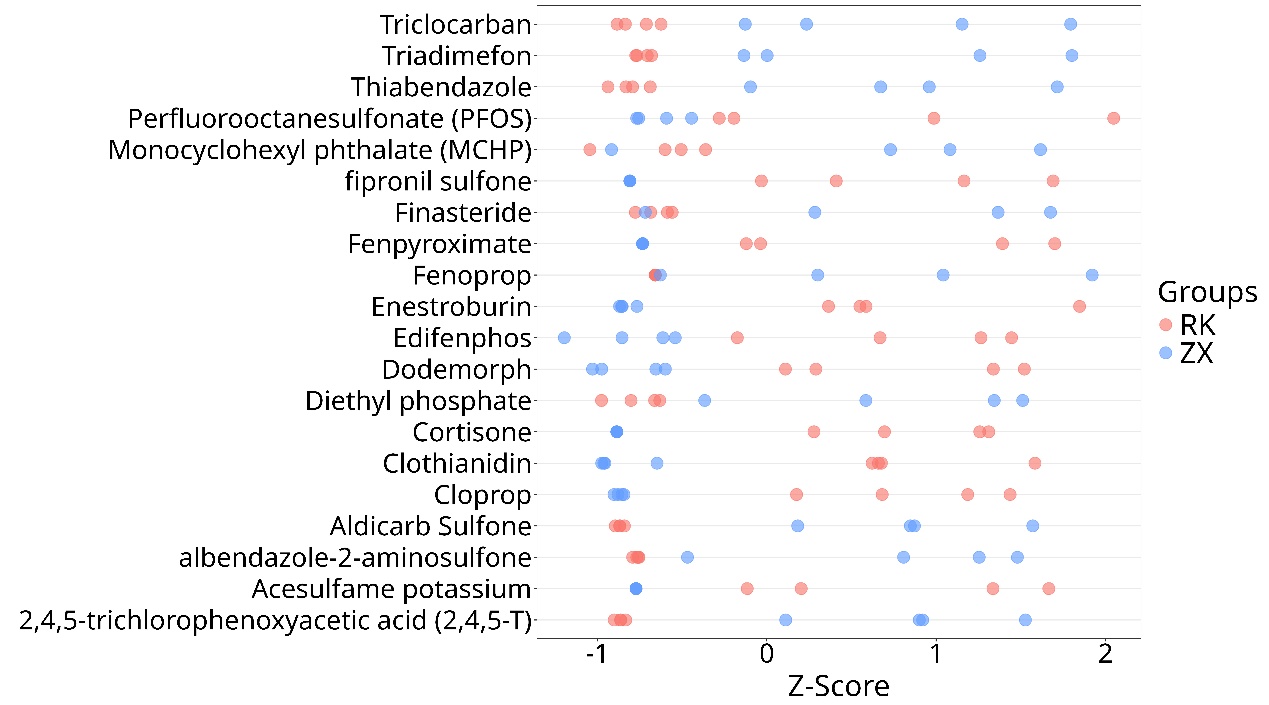
Intergroup Z-score Plot
Z-score distribution of differential exposures across samples, comparing direction and magnitude of exposure shifts between groups.
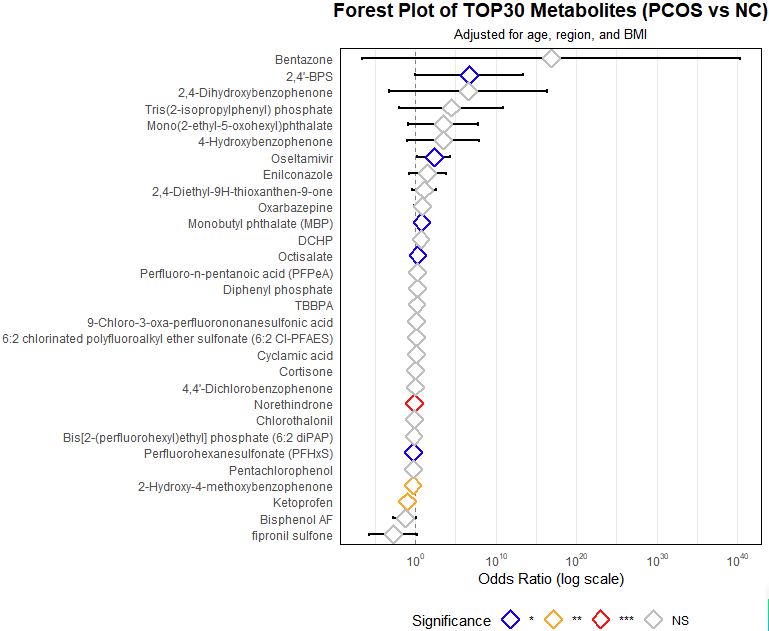
Exposure–Disease Association Forest Plot
Odds ratios (log scale) and significance of top-30 exposure–disease associations, adjusted for age, region and BMI.
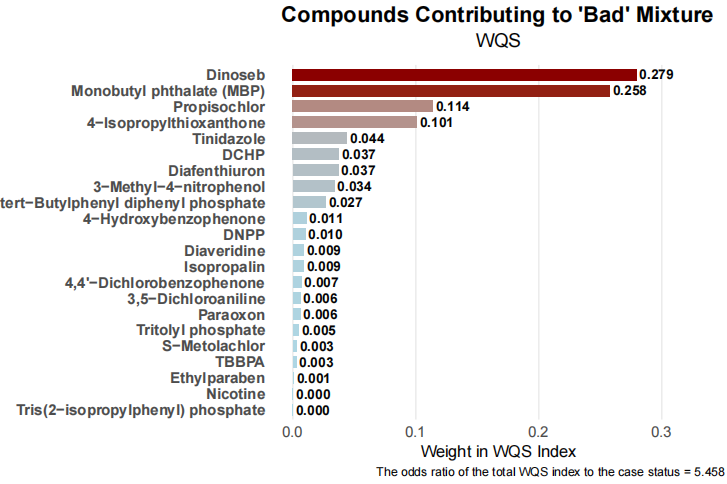
WQS Joint-Exposure Weight Analysis
Weighted quantile sum (WQS) regression estimates each exposure's contribution weight to the mixture effect and overall risk.

Applications

APPLICATIONS
Environmental Pollutant Exposure AssessmentOccupational Health MonitoringFood Safety Risk-Compound ScreeningExposure–Disease AssociationEnvironmental Epidemiology Cohorts

FAQ

FAQ
How long does a Environmental Exposomics project take?
Mature targeted panels typically take 1-3 weeks; untargeted projects take 2-4 weeks (counted from sample receipt and QC approval). The exact timeline is confirmed in writing before project start, and progress is trackable on the OmicsHub cloud platform.
What if my sample amount is below the recommendation?
Please do not dilute your samples. Low-input samples can often be accommodated by adjusting the preparation workflow — tell us the actual amount and our technical team will assess feasibility and note adjustments in the study plan.
Can I add targets to an existing panel?
Yes. Mature panels support on-demand additions; novel analytes outside the list can be implemented through custom method development (requires standards and extra validation time) — see our Custom Targeted Metabolomics service.
What samples do you need for Environmental Exposomics?
Serum/plasma ≥100 μL (fasting, no haemolysis), tissue ≥50 mg (snap-frozen), cells ≥1×10⁶ (medium washed off), urine ≥200 μL. Keep fasting time consistent, aliquot into single-use volumes and avoid freeze–thaw. Full guidance: Technical Resources → Sample Guide.

Delivery timing: sample shipping, customs declaration and similar steps may extend turnaround; actual project timelines prevail.

Request a Quote or Study Design

Tell us about your project — we reply within one business day (free assessment)

Used only for this enquiry; never shared.

Start Your Multi-omics Project

Free study design · Interactive execution · In-depth data interpretation

Official Channels
OFFICIAL CHANNELS
WeChat Official Account QR
Official Account
WECHAT OFFICIAL ACCOUNT
WeChat QR
WeChat Service
CUSTOMER SERVICE
Xiaohongshu QR
Xiaohongshu
XIAOHONGSHU
Call us:400-660-8826
WeChat QR
Scan to chat on WeChat