TRANSCRIPTOMICS

Eukaryotic RNA-seq

Eukaryotic Transcriptome Sequencing — Expression & Differential Analysis

Eukaryotic RNA-seq provides a panoramic view of mRNA expression: total RNA is enriched for mRNA with Oligo(dT) magnetic beads, library-prepped and sequenced; after QC, reads are aligned to the reference genome with STAR for gene/transcript-level quantification, followed by differential expression, GO / KEGG enrichment and GSEA analyses.

Oligo(dT)
mRNA Enrichment & Library Prep
mRNA ENRICHMENT
STAR
Reference Genome Alignment
REFERENCE ALIGNMENT
8
Analysis Modules
ANALYSIS MODULES

Technical Specifications

TECHNICAL SPECIFICATIONS
ItemDetails
Library PrepOligo(dT) bead-based mRNA enrichment
Read AlignmentSTAR aligns cleaned reads to the reference genome; sequencing and library quality assessed by mapping rate, insert size and coverage uniformity
QuantificationGene/transcript quantification against the annotation, outputting Count, FPKM, TPM and log2TPM
DE ThresholdsRead-count normalization (depth correction) → statistical modeling for P values → BH adjustment (padj); default |log2(FoldChange)| > 1 and padj < 0.05
Standard DeliveryRaw data + analysis report

Analysis Workflow

ANALYSIS WORKFLOW
1
Data QC
Adapter trimming · rRNA assessment
2
Read Alignment
STAR · reference genome
3
Quantification
Count / FPKM / TPM
4
Expression QC
Correlation · PCA
5
Differential Analysis
Volcano · clustering
6
GO Enrichment
BP / CC / MF
7
KEGG Enrichment
Pathways · bubble plots
8
GSEA
GO / KEGG gene sets

Bioinformatics Analyses

BIOINFORMATIC MODULES
ModuleCore Methods & MetricsKey Outputs
Sequencing StatisticsBase-quality and content distributions of raw fastq (R1/R2); 3′/5′ adapter trimming; filtering reads with mean quality < 20 or length < 50 bp and reads containing N; rRNA contamination rate assessmentRaw and cleaned data statistics tables, base-quality and content distribution plots
Alignment QCSTAR aligns cleaned reads to the reference genome; sequencing and library quality assessed at checkpoints including mapping rate, insert size and coverage uniformityMapping-rate statistics tables, per-sample alignment detail plots
mRNA QuantificationGene/transcript quantification against the annotation with Count, FPKM, TPM and log2TPM outputs; Top-10 highly expressed transcripts summarizedExpression matrices, Top-10 expression tables
Expression Distribution & QCExpression density distributions; per-sample violin/box plots; inter-sample Pearson correlation heatmaps (ideal within-group R² > 0.9) and PCADensity plots, violin/box plots, correlation heatmaps, PCA plots
Differential AnalysisRead-count normalization (depth correction) → statistical modeling for P values → BH multiple-testing adjustment (padj); default |log2(FoldChange)| > 1 and padj < 0.05Differential analysis result tables, volcano plots
DE PatternsExpression-pattern clustering of differential genes; shared and unique DEG statistics across multiple comparisonsPattern-clustering heatmaps, shared-DEG diagrams
GO Functional EnrichmentGO enrichment of DEGs (BP / CC / MF), reporting GeneRatio / BgRatio, enrichment factor and adjusted p-valuesGO enrichment bubble and bar plots
KEGG & GSEAKEGG pathway enrichment of DEGs; GSEA based on GO and KEGG gene sets, reporting ES, NES and adjusted p-valuesKEGG enrichment plots, GSEA enrichment plots and dot plots

Example Results

SELECTED FIGURES FROM ACTUAL REPORTS
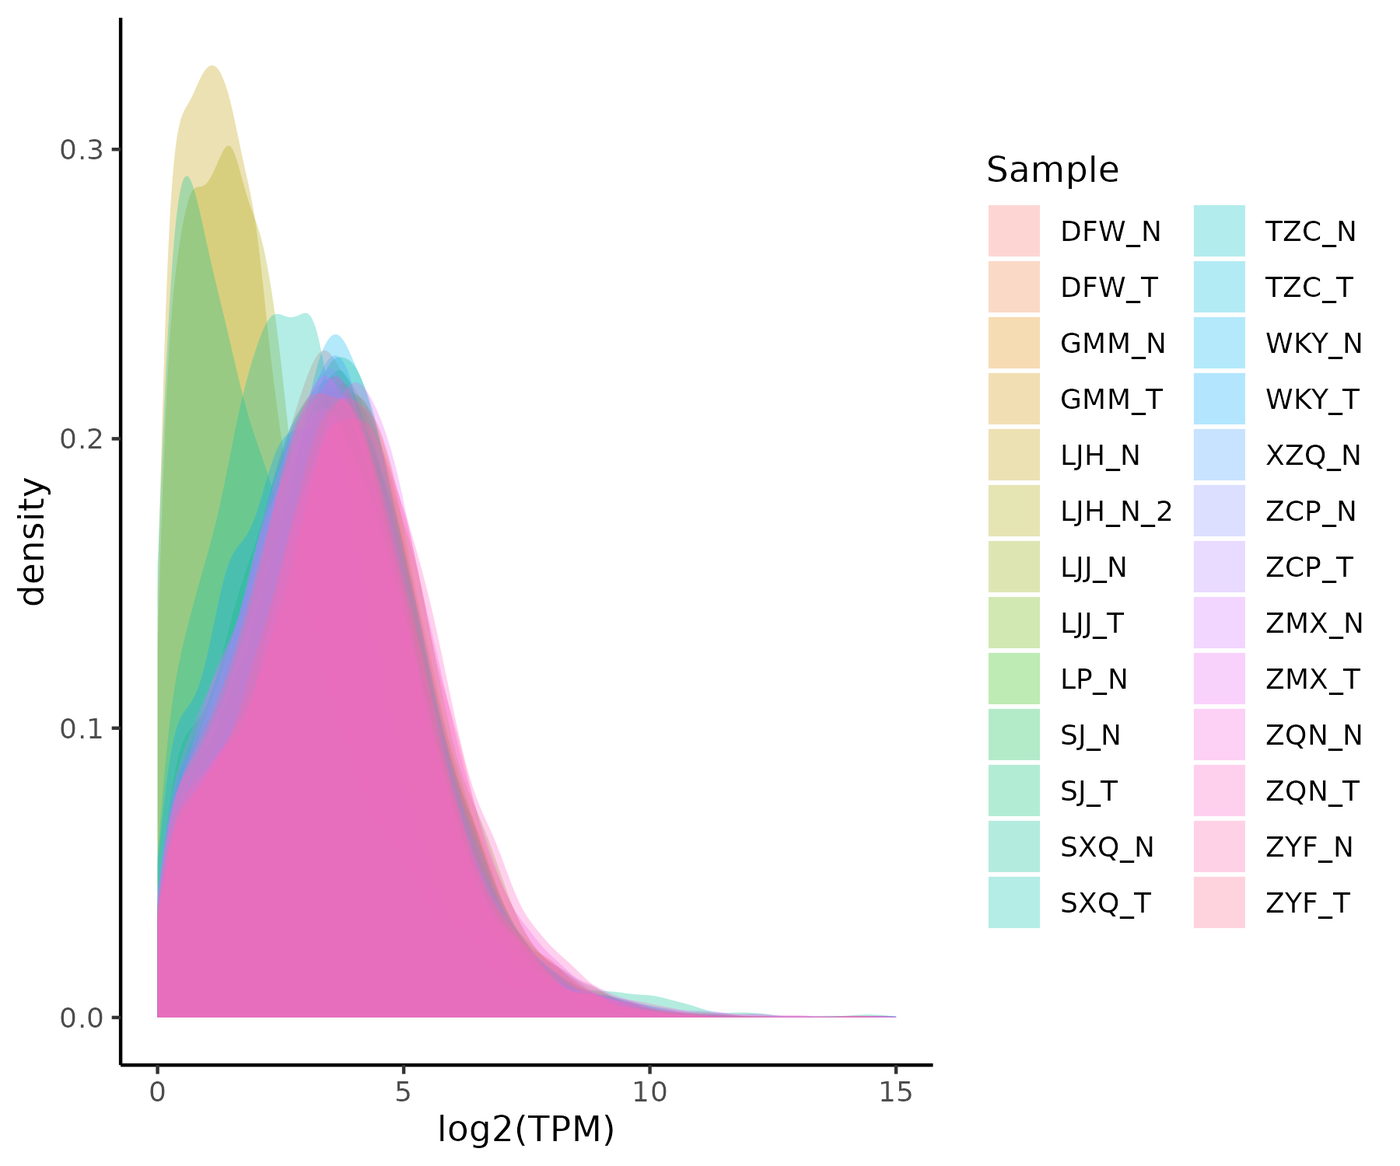
Gene Expression Density
log2(TPM) density curves per sample, assessing consistency of expression distributions.
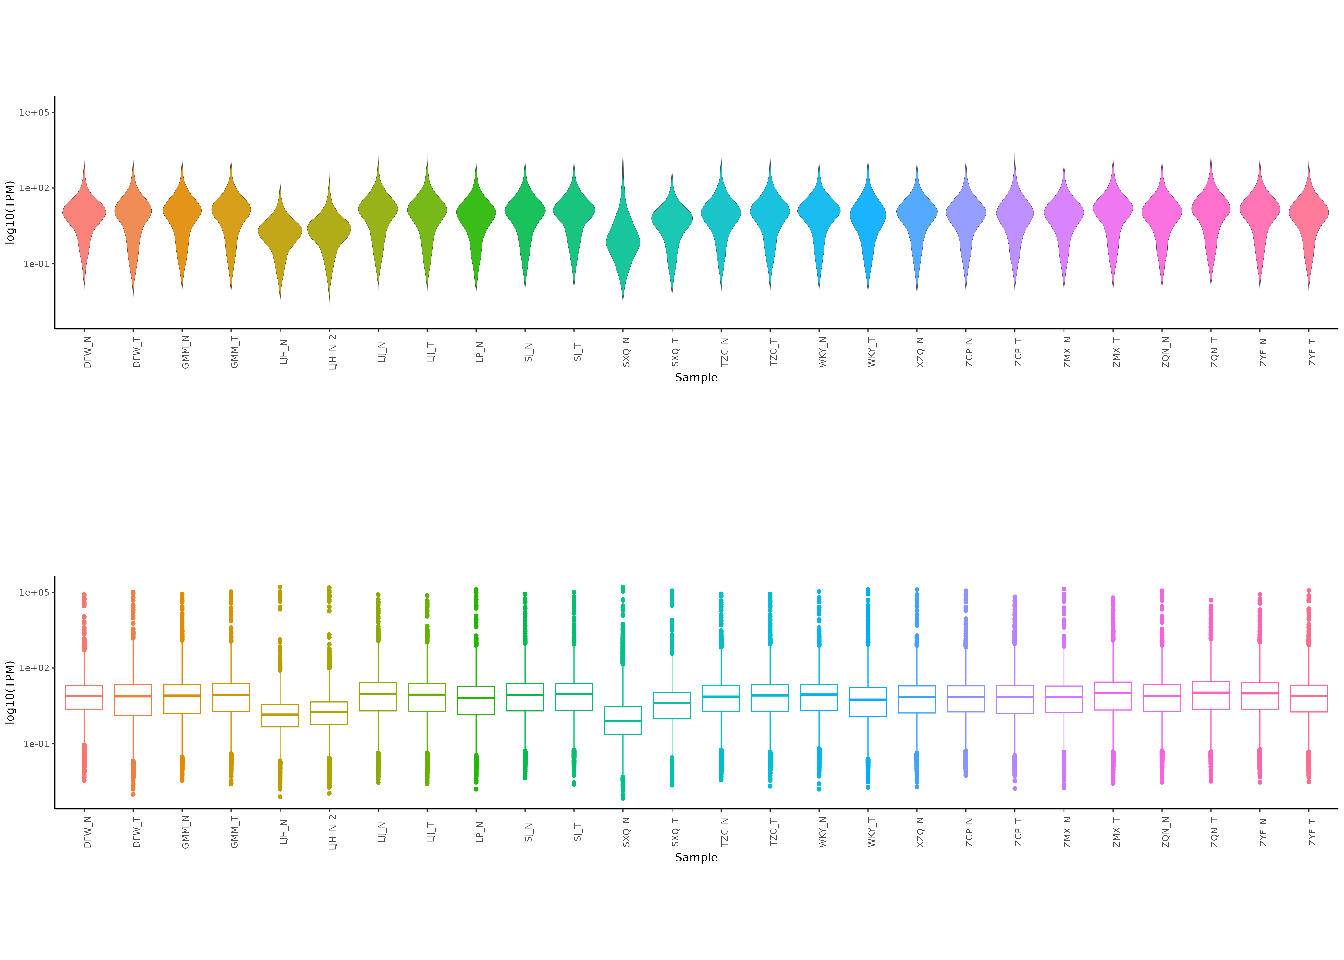
Expression Violin / Box Plots
Distribution and probability density of gene-expression values per sample; boxes show medians and quartiles.
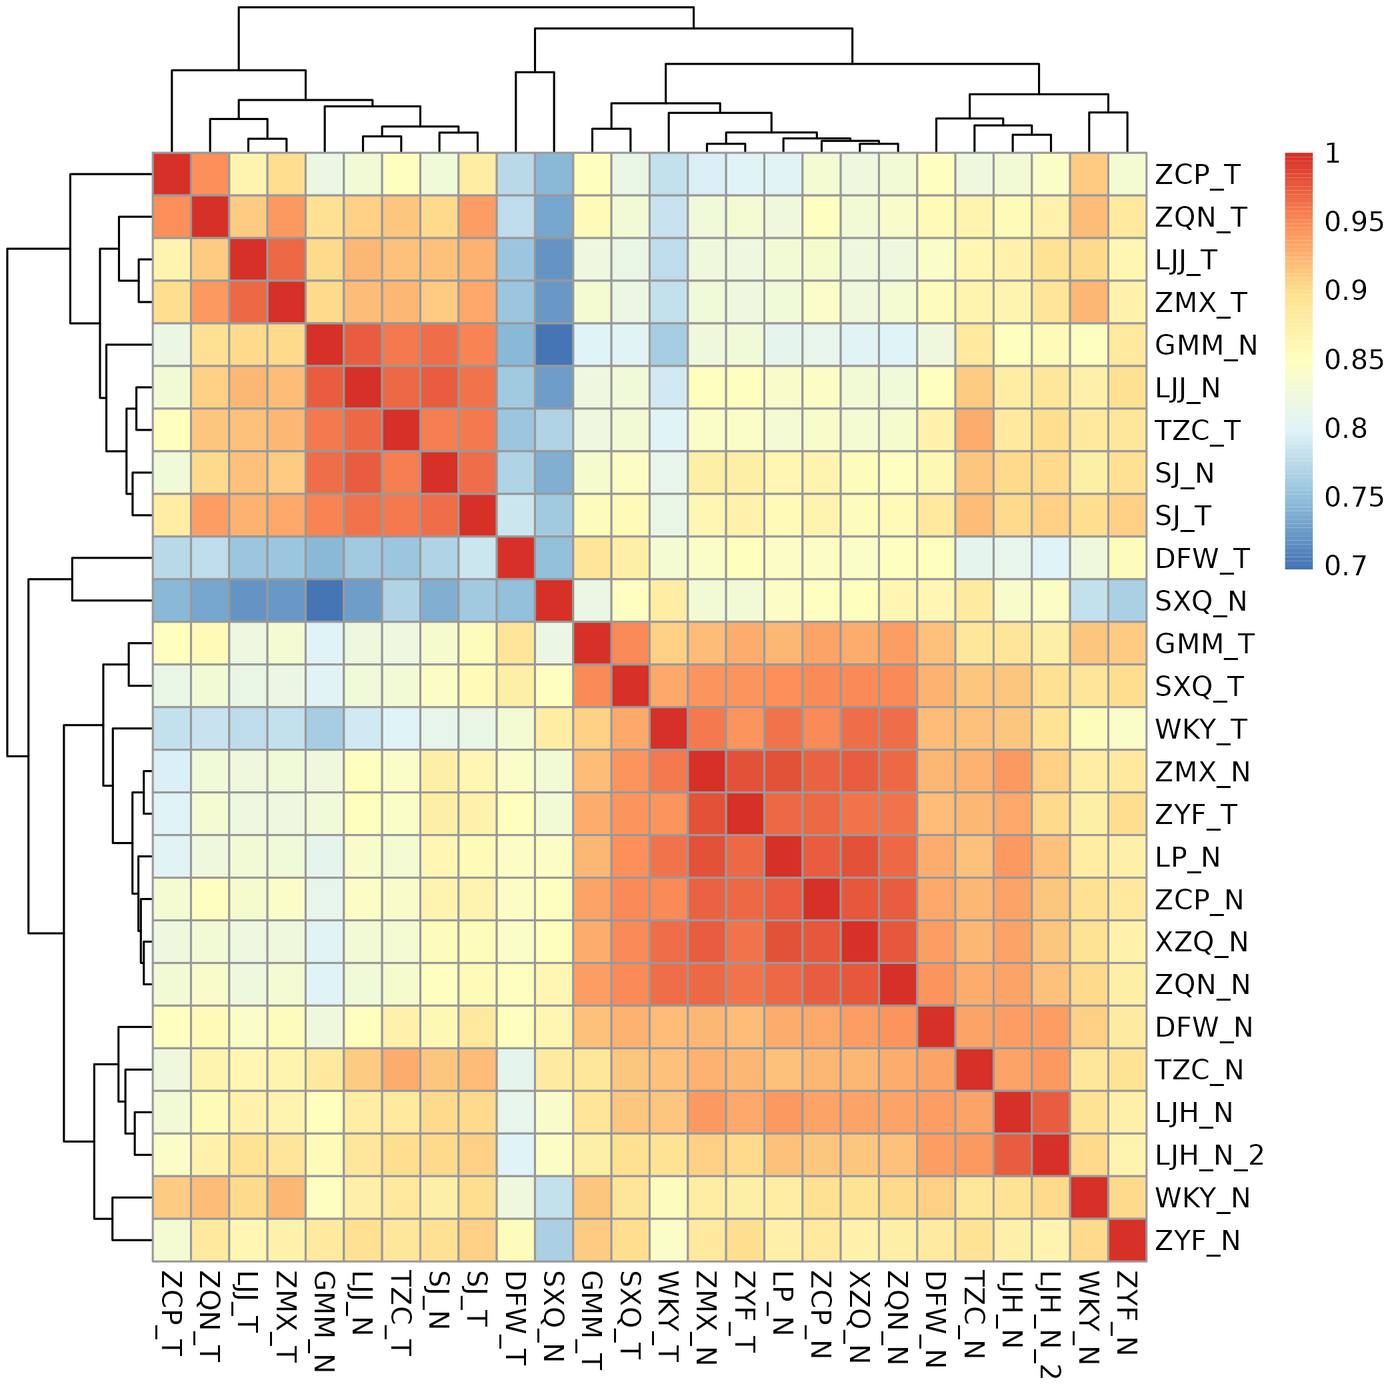
Inter-Sample Correlation Heatmap
Pairwise Pearson correlations and hierarchical clustering of samples, assessing biological-replicate consistency.
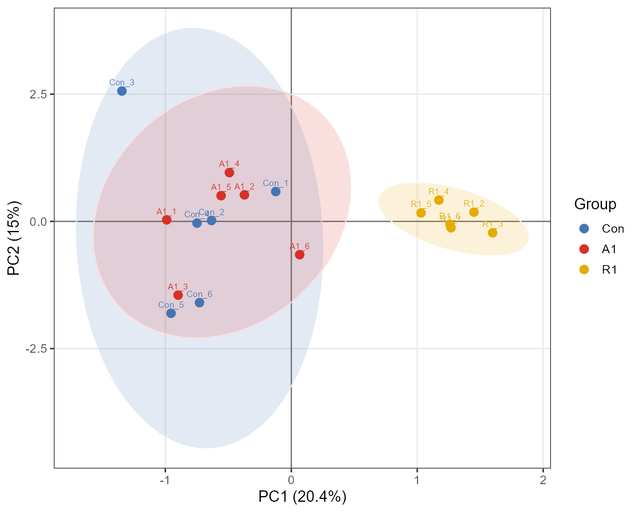
Inter-Sample PCA
Inter-Sample PCA
Sample distribution after dimensionality reduction, showing intergroup separation and within-group clustering.
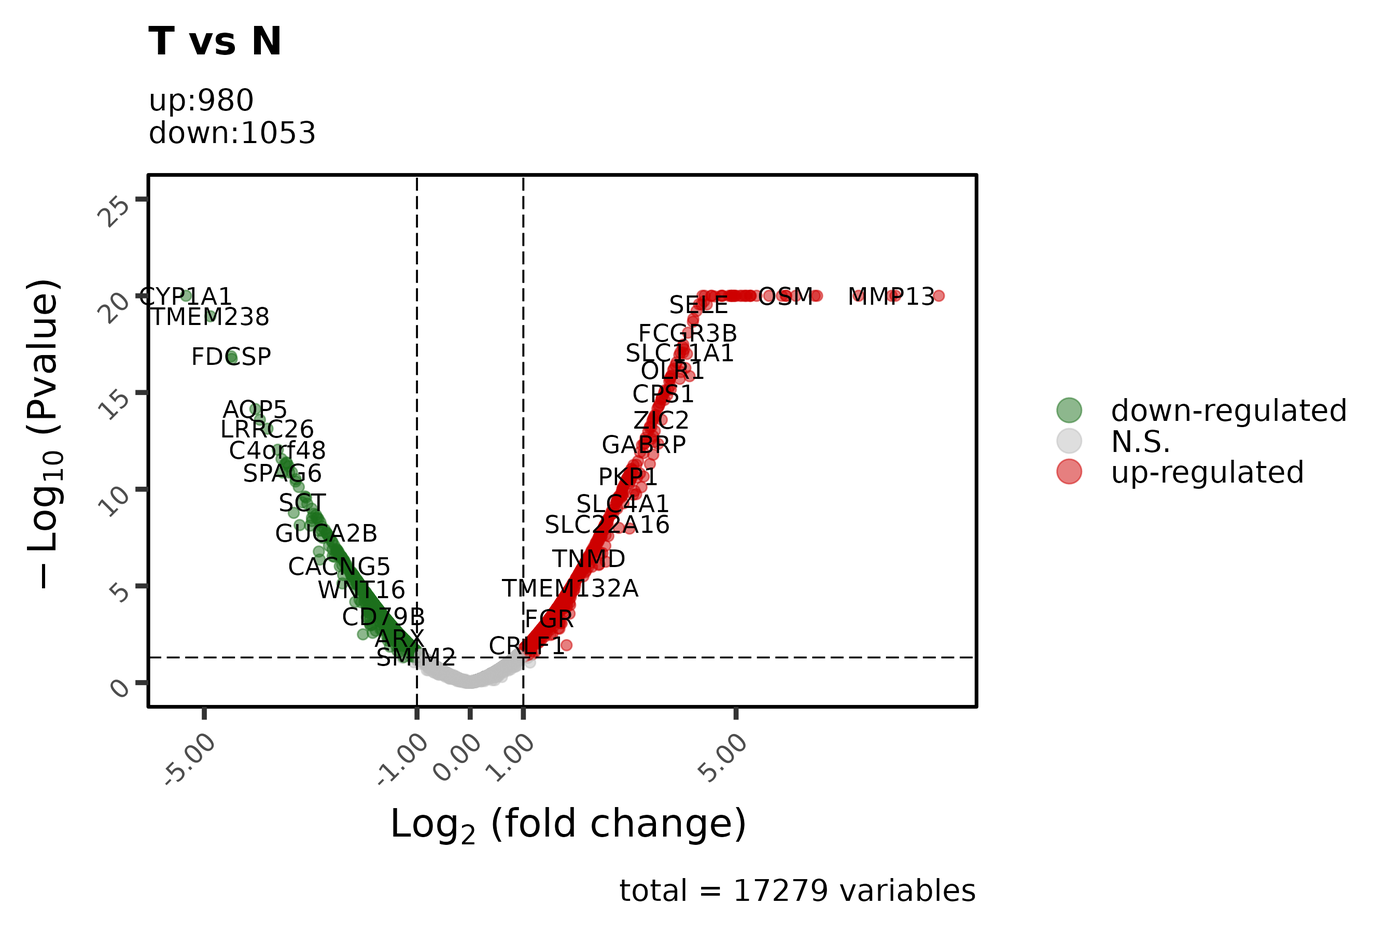
Differential Expression Volcano Plot
Dual thresholds of log2(FoldChange) and −log10(P) mark up/down-regulated genes, with key genes labeled.
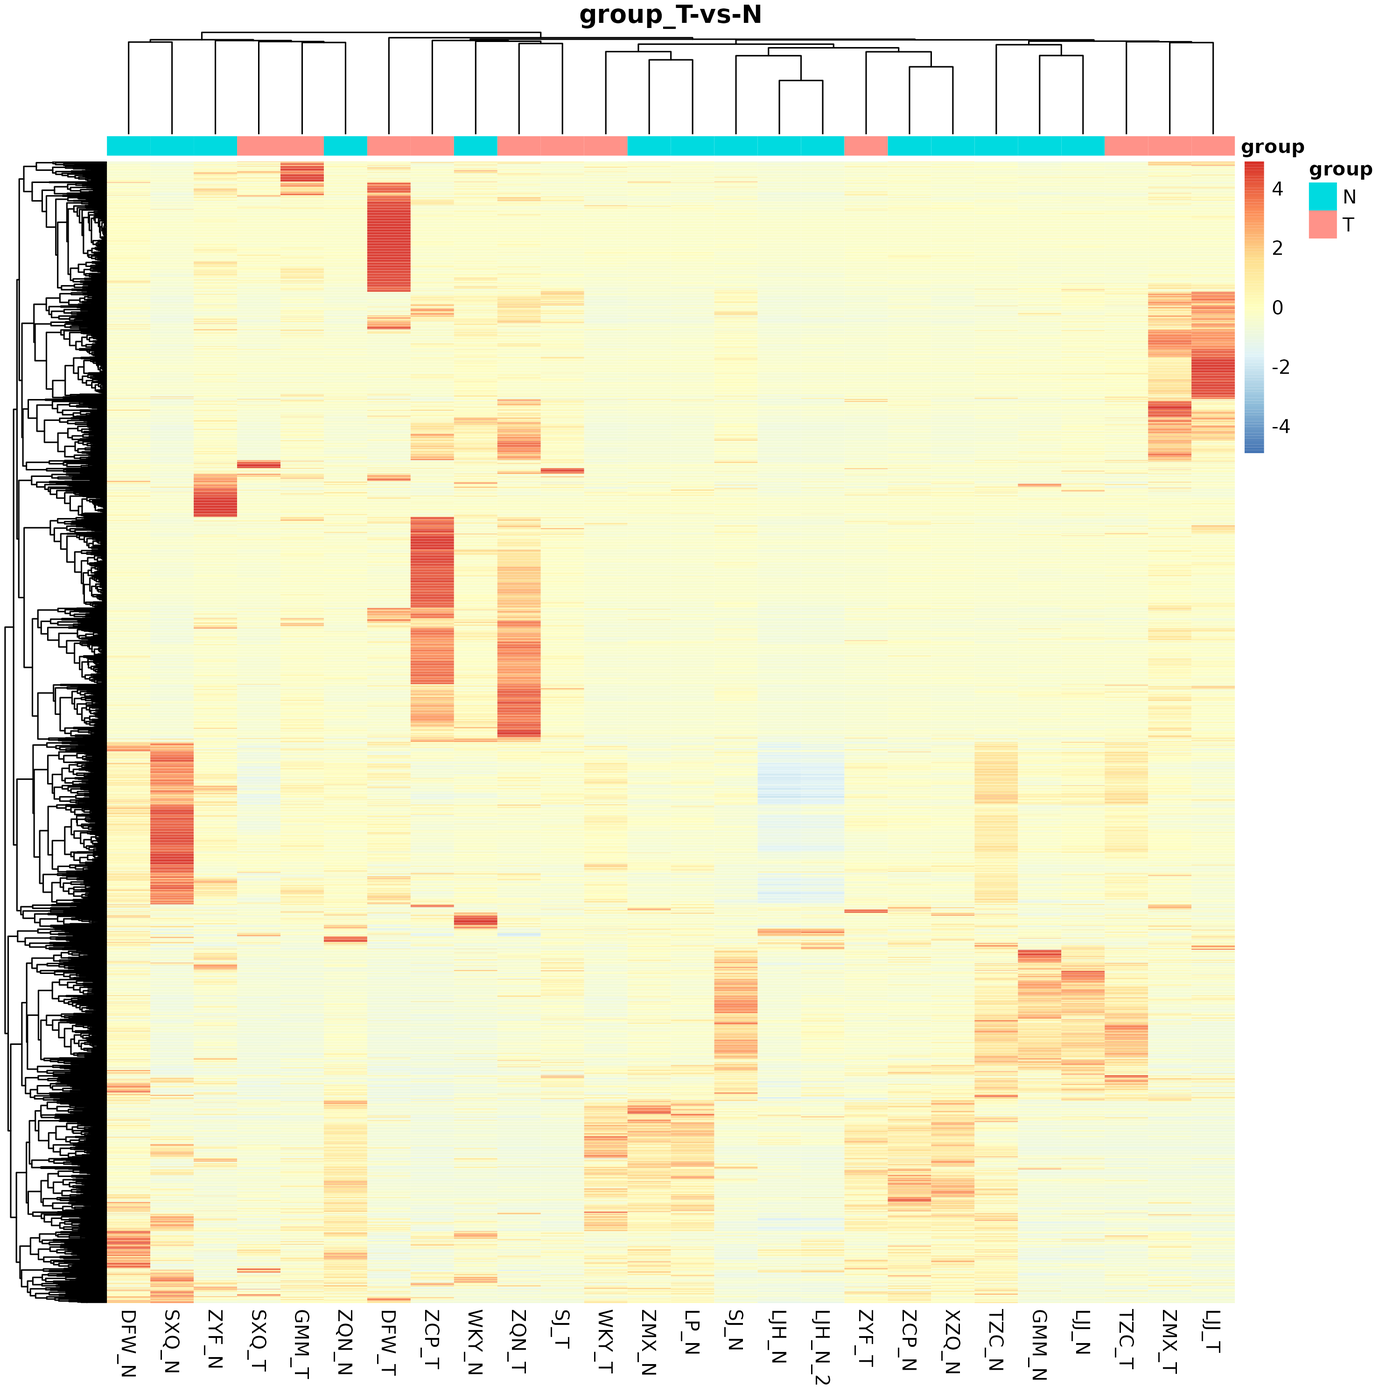
DEG Expression-Pattern Clustering
Expression patterns of DEGs across samples (log10 TPM), with two-way clustering of genes and samples.
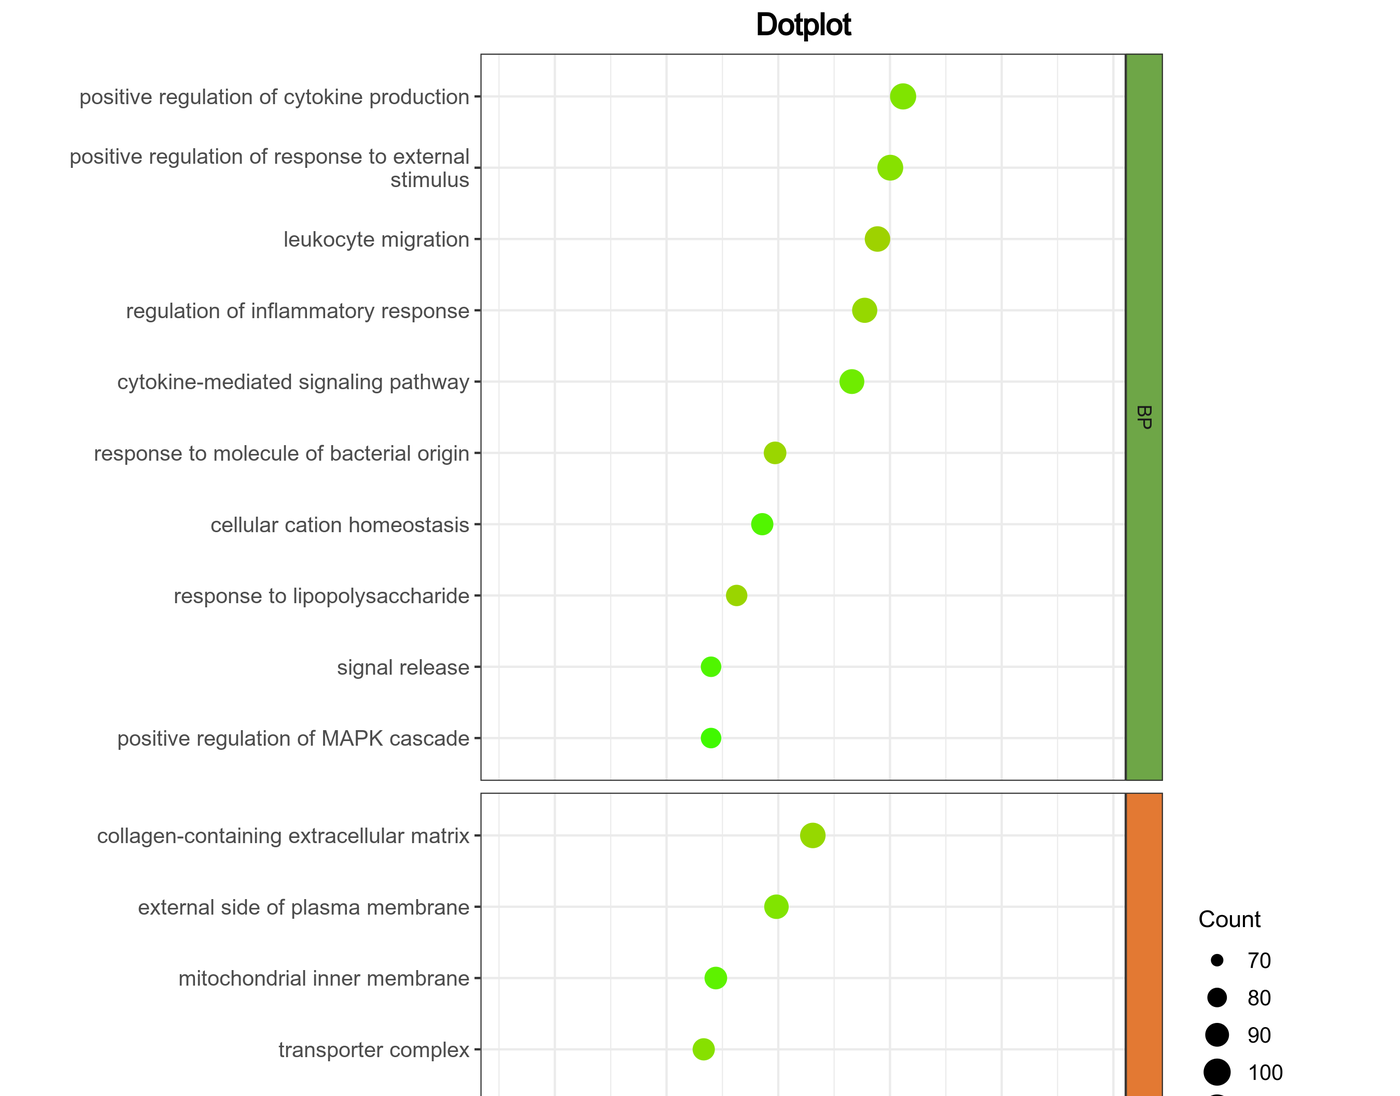
GO Functional Enrichment (Excerpt)
Enrichment results and significance of GO terms (BP / CC / MF) for DEGs; top terms shown.
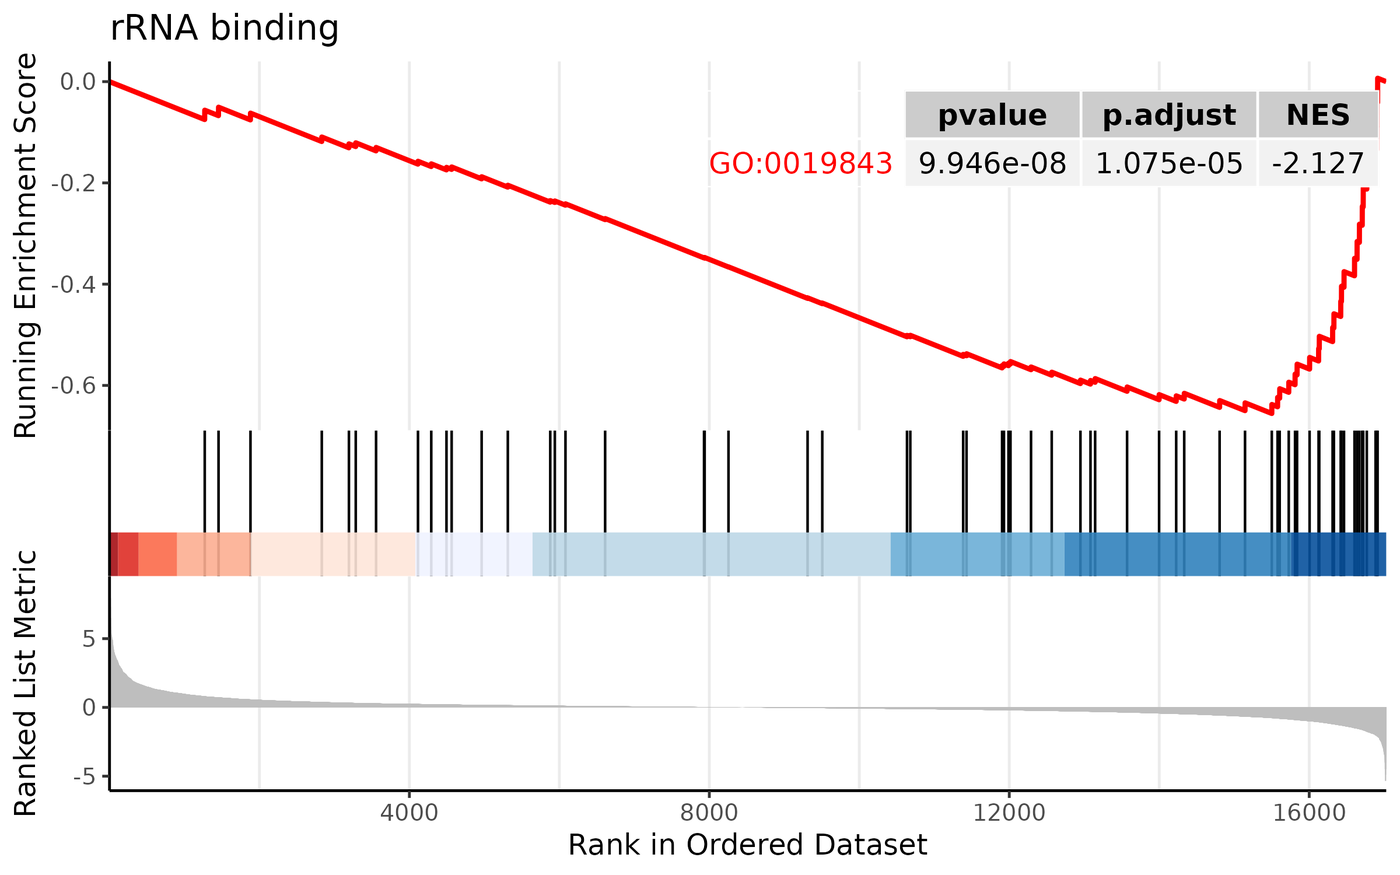
GO-based GSEA Enrichment Plot
Enrichment-score curves with ranked-gene positions, annotated with NES and adjusted p-values.
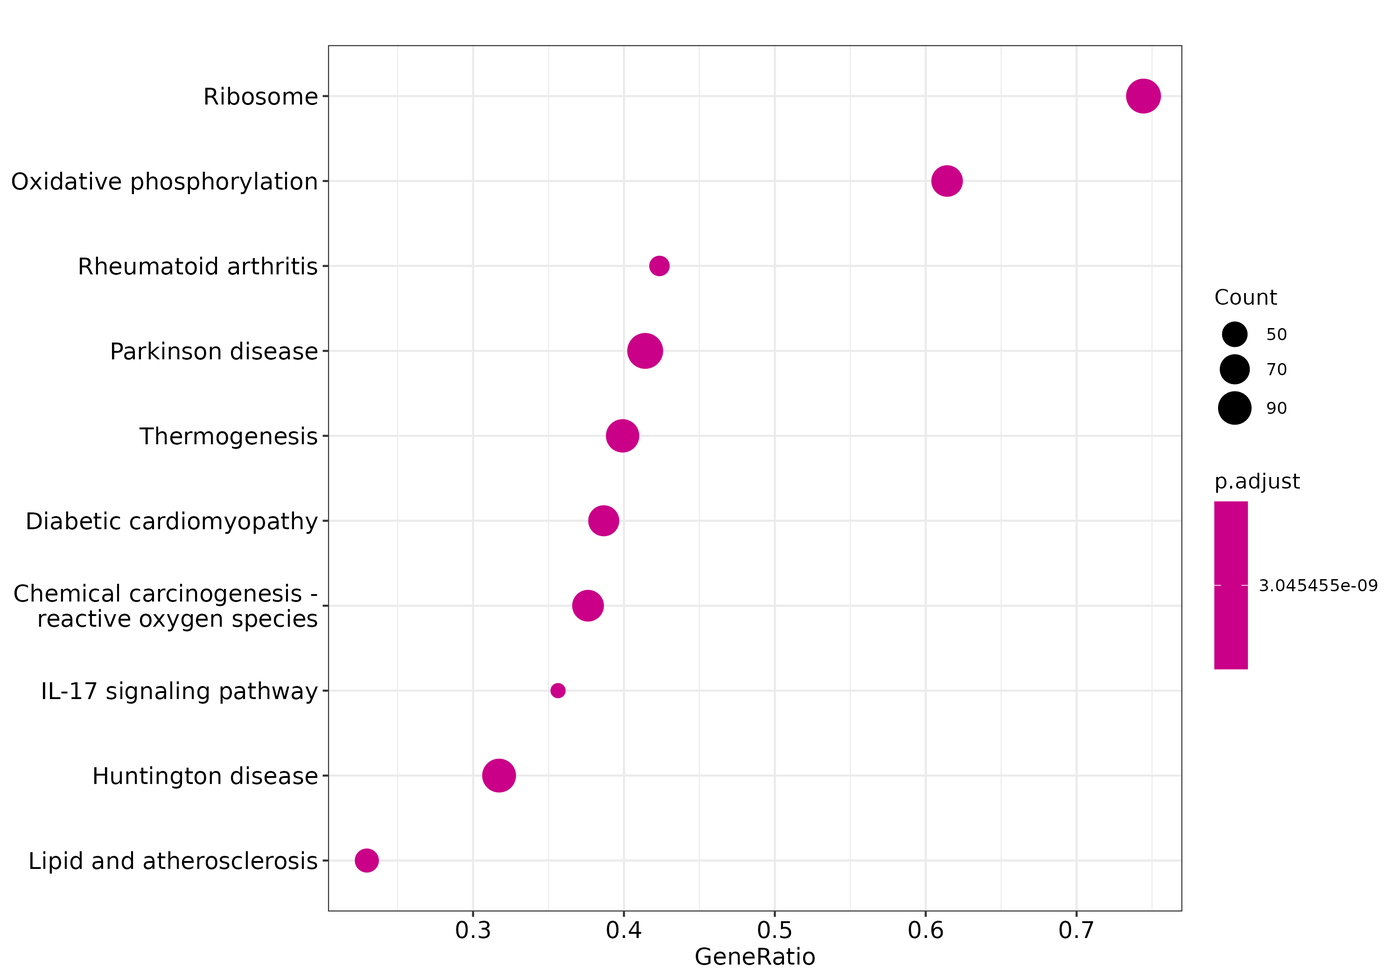
KEGG-based GSEA Dot Plot
Gene ratios and significance of KEGG pathway enrichment; dot size indicates enriched gene counts.

FAQ

FAQ
How long does a Eukaryotic RNA-seq project take?
From sample QC approval, standard timelines are 3-6 weeks (library prep, sequencing and bioinformatics included); large cohorts or deep custom analyses follow the confirmed study plan.
What if my samples fail QC?
Failed QC is reported immediately with reasons, and we discuss resampling or plan adjustments with you — sequencing never proceeds without qualification.
What bioinformatics is included? Can I add custom analyses?
Standard delivery covers QC, mapping/assembly, quantification, differential and functional enrichment analyses. Custom deep-dive and multi-omics integrative analyses are supported on request.
What samples do you need for Eukaryotic RNA-seq?
Total RNA ≥1 μg with RIN ≥7 (snap-frozen, dry ice); microbial and faecal samples ≥200 mg (sterile, −80 °C); whole blood for WGS ≥500 μL (EDTA only, never heparin). RNA integrity matters more than concentration. See Technical Resources → Sample Guide.

Delivery timing: sample shipping, customs declaration and similar steps may extend turnaround; actual project timelines prevail.

Request a Quote or Study Design

Tell us about your project — we reply within one business day (free assessment)

Used only for this enquiry; never shared.

Start Your Multi-omics Project

Free study design · Interactive execution · In-depth data interpretation
Official Channels
OFFICIAL CHANNELS
WeChat Official Account QR
Official Account
WECHAT OFFICIAL ACCOUNT
WeChat QR
WeChat Service
CUSTOMER SERVICE
Xiaohongshu QR
Xiaohongshu
XIAOHONGSHU
Call us:400-660-8826
WeChat QR
Scan to chat on WeChat