ISOTOPE TRACING

Metabolic Flux & Isotope Tracing

Stable Isotope Tracing — Quantify Flux, Not Just Abundance

Isotope-tracing metabolic flux analysis feeds cells or infuses animals with stable-isotope (¹³C / ¹⁵N) labeled substrates; once the label incorporates into downstream metabolites, mass spectrometry measures their mass isotopomer distributions (MID) and positional isotopomers — isotopomer patterns carry far more pathway information than concentrations alone: conventional metabolomics answers "how much", while flux analysis answers "where from, where to, and via which route". Single tracers reveal pathways through isotopomer ratios; parallel multi-tracer designs quantify absolute fluxes; positional isotopomers resolve metabolic branch points. The workflow runs "labeled-substrate incubation → MS detection of MID → natural-abundance correction → metabolic network modeling". Tracer choice directly determines which pathways can be resolved and must be fixed during study design together with the research question.

13C / 15N
Stable-Isotope Tracing
STABLE ISOTOPE TRACING
6
Traceable Pathways
TRACER PATHWAYS
4–6 weeks
Standard Turnaround
PROJECT CYCLE

Specifications & Samples

TECHNICAL SPECIFICATIONS
ItemDetails
PlatformQ Exactive high-resolution MS with polarity switching and isotopomer-resolved acquisition; complementary GC-MS / LC-MS dual platforms
Samples & SystemsIn vitro cell models (tumor, primary, stem cells) · in vivo animal models · microbial fermentation systems · plant tissues · plasma and other biofluids; after labeling, snap-freeze samples in liquid nitrogen and ship on dry ice
Deliverables & TimelineStatistics tables · MID tables · analysis report; standard turnaround 4–6 weeks
Information to ConfirmResearch background and questions · sample types and comparison design · target pathways · expected sample size and labeled substrates

Workflow

SERVICE WORKFLOW
1
Labeled Incubation
Switch to isotope medium at steady state
2
MS Detection of MID
GC-MS / LC-MS dual platforms
3
Natural-Abundance Correction
Subtract natural-isotope background
4
Network Modeling
Flux estimation (when applicable)
5
Statistics & Visualization
Flux maps, heatmaps & interpretation
Study-design support: full support for ¹³C / ¹⁵N tracer selection and sourcing, labeling dose and duration, and sampling time-point design — controlling tracing costs while keeping fluxes measurable.

Traceable Pathways & Representative Tracers

TRACER PATHWAYS
PathwayCommon Tracers / Representative Substrates · Resolvable Readouts
1 · Glucose Flux GLUCOSE FLUX[U-¹³C]glucose / [1,2-¹³C]glucose / [1,6-¹³C]glucose / [2,3-¹³C]glucose — flux partitioning among glycolysis, the TCA cycle and the pentose phosphate pathway; [1,6-¹³C] and [2,3-¹³C] distinguish PPP branches and PDH activity; Warburg-effect quantification in tumors and proliferating cells
2 · Fatty Acid Flux FATTY ACID FLUX[U-¹³C]acetate / [U-¹³C]palmitate — relative contributions of de novo lipogenesis (DNL) versus exogenous uptake; acetyl-CoA pools and fatty-acid β-oxidation; chain elongation and desaturation fates
3 · Nucleotide Flux NUCLEOTIDE FLUX[U-¹³C]nucleosides/nucleotides / [¹⁵N4]hypoxanthine — balance between de novo and salvage synthesis of purines/pyrimidines; resolving the sources of proliferation-driven nucleotide demand
4 · Amino Acid Flux AMINO ACID FLUX[U-¹³C]glutamine / [amide-¹⁵N]glutamine / [U-¹³C]serine — nitrogen flow through glutaminolysis, TCA anaplerosis and transamination; carbon-skeleton exchange among amino acids
5 · Folate / One-Carbon Flux ONE-CARBON FLUX[U-¹³C]serine / [U-¹³C]glycine — carbon-source assignment for one-carbon units, purine synthesis and methylation; folate-cycle efficiency assessment
6 · Urea Cycle Flux UREA CYCLE FLUX¹⁵N-NH₄Cl / [amide-¹⁵N]glutamine — nitrogen metabolism and urea-cycle flux; ammonia-clearance efficiency and ¹⁵N fate in purine synthesis

Bioinformatics Analyses

BIOINFORMATIC MODULES
ModuleMethods & Metrics · Key Outputs
Data PreprocessingMetabolite peak extraction and integration, mass-isotopomer (M+0 / M+1 / M+2 …) signal extraction, sample naming and group mapping, low-quality peak filtering — raw and corrected MID data tables
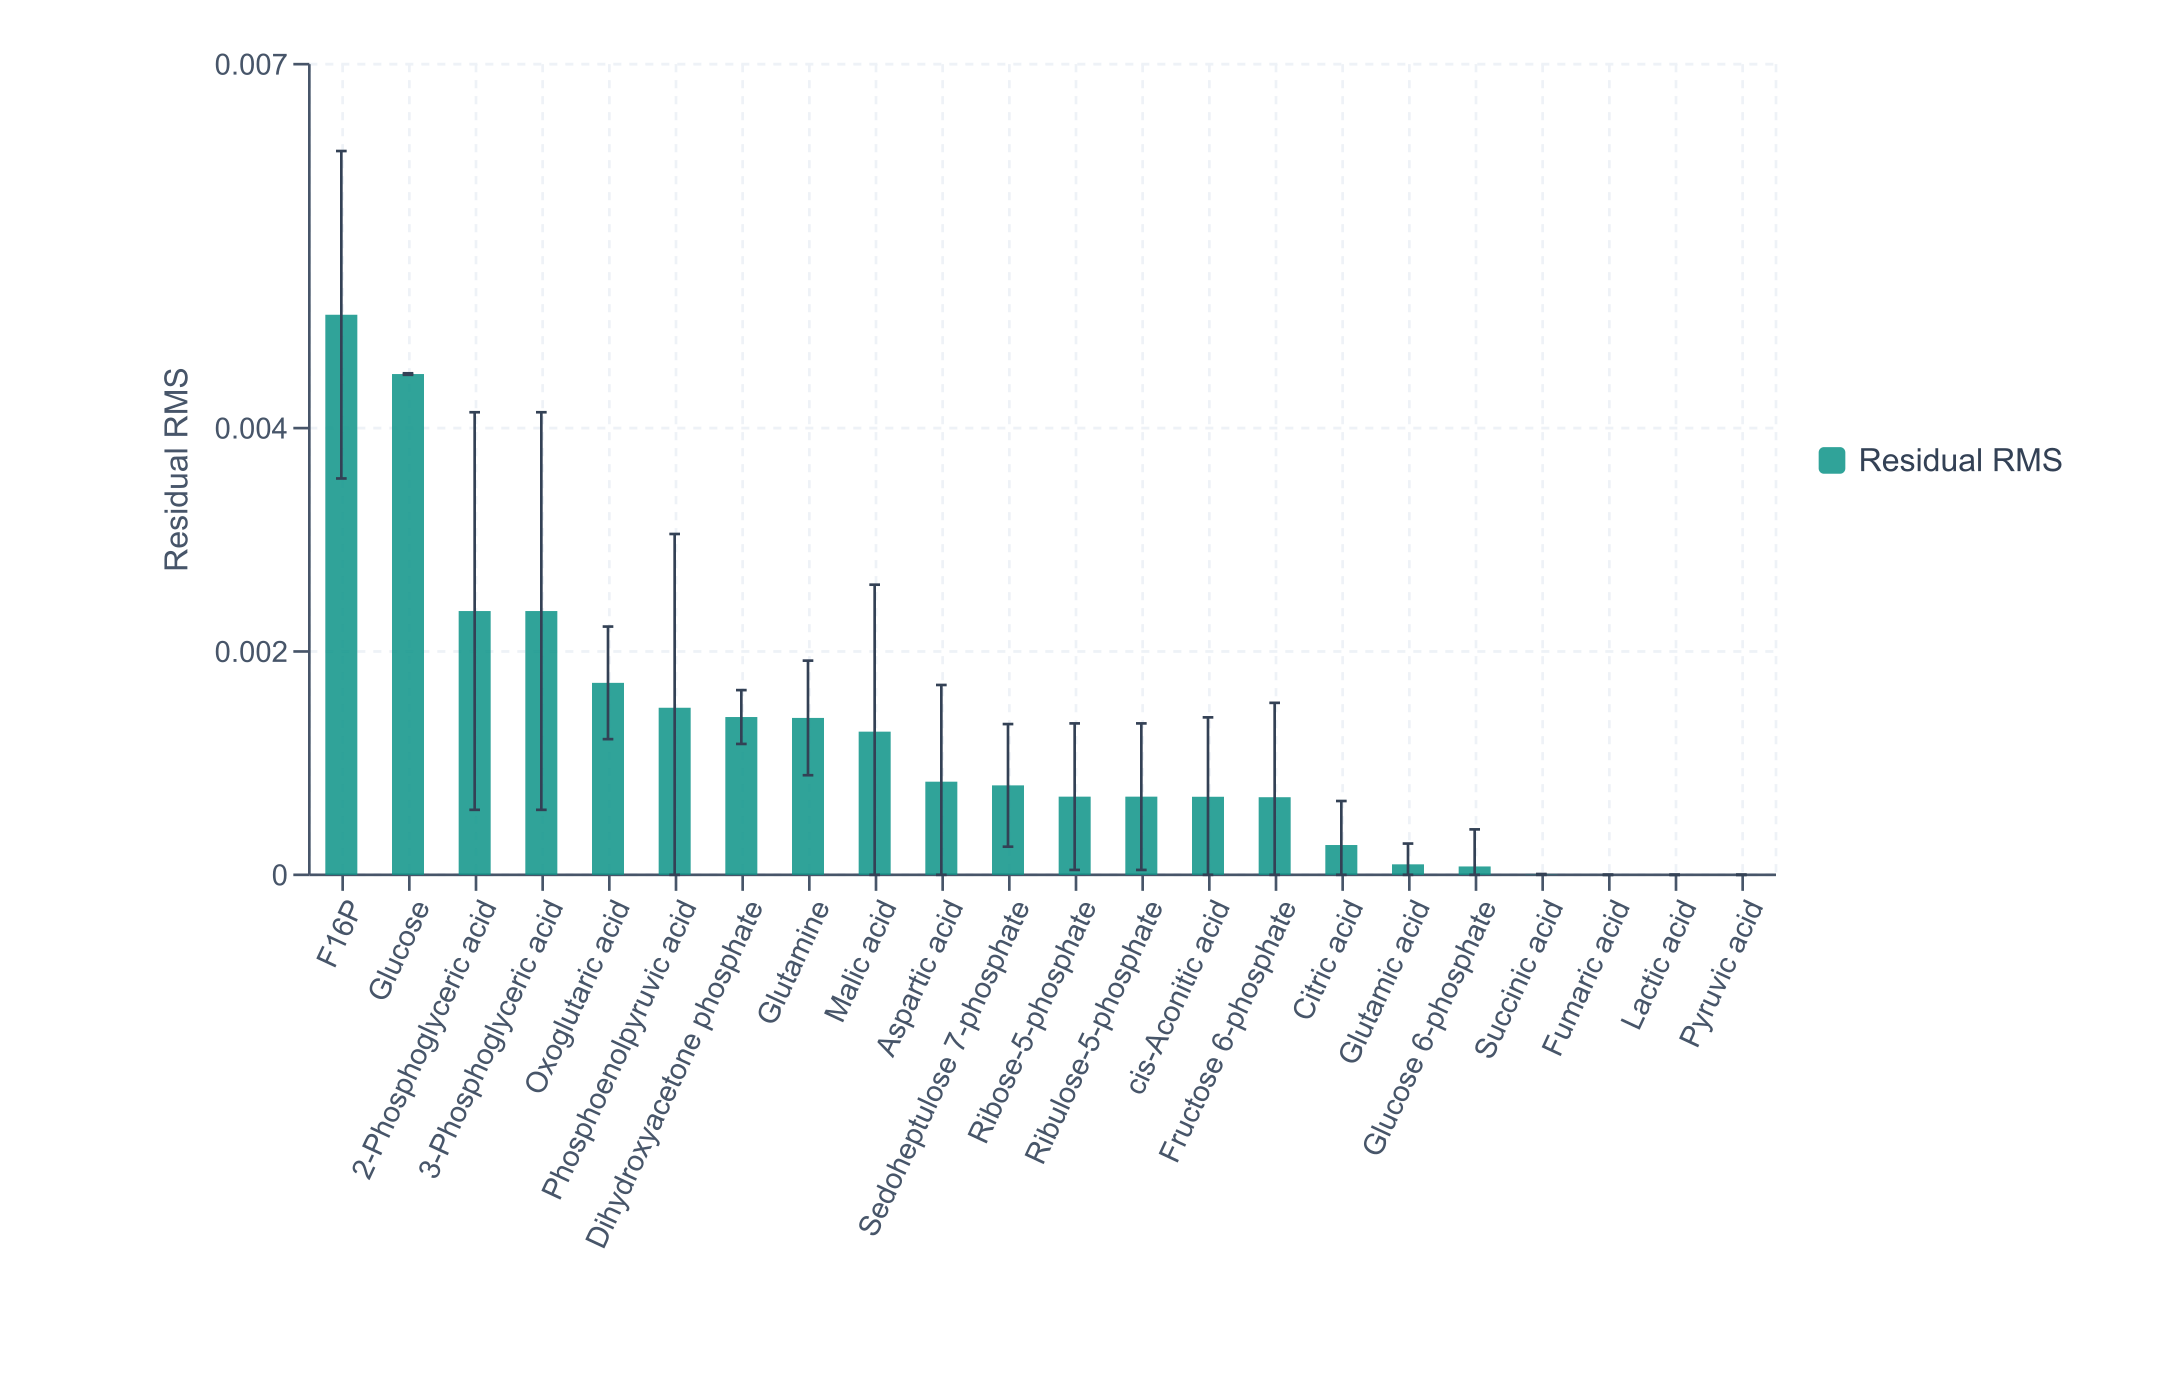
Natural-Abundance CorrectionMatrix-based subtraction of natural ¹³C / ¹⁵N / ¹⁸O / ²H backgrounds; correction quality assessed by residual RMS — RMS bar charts, before/after comparison plots
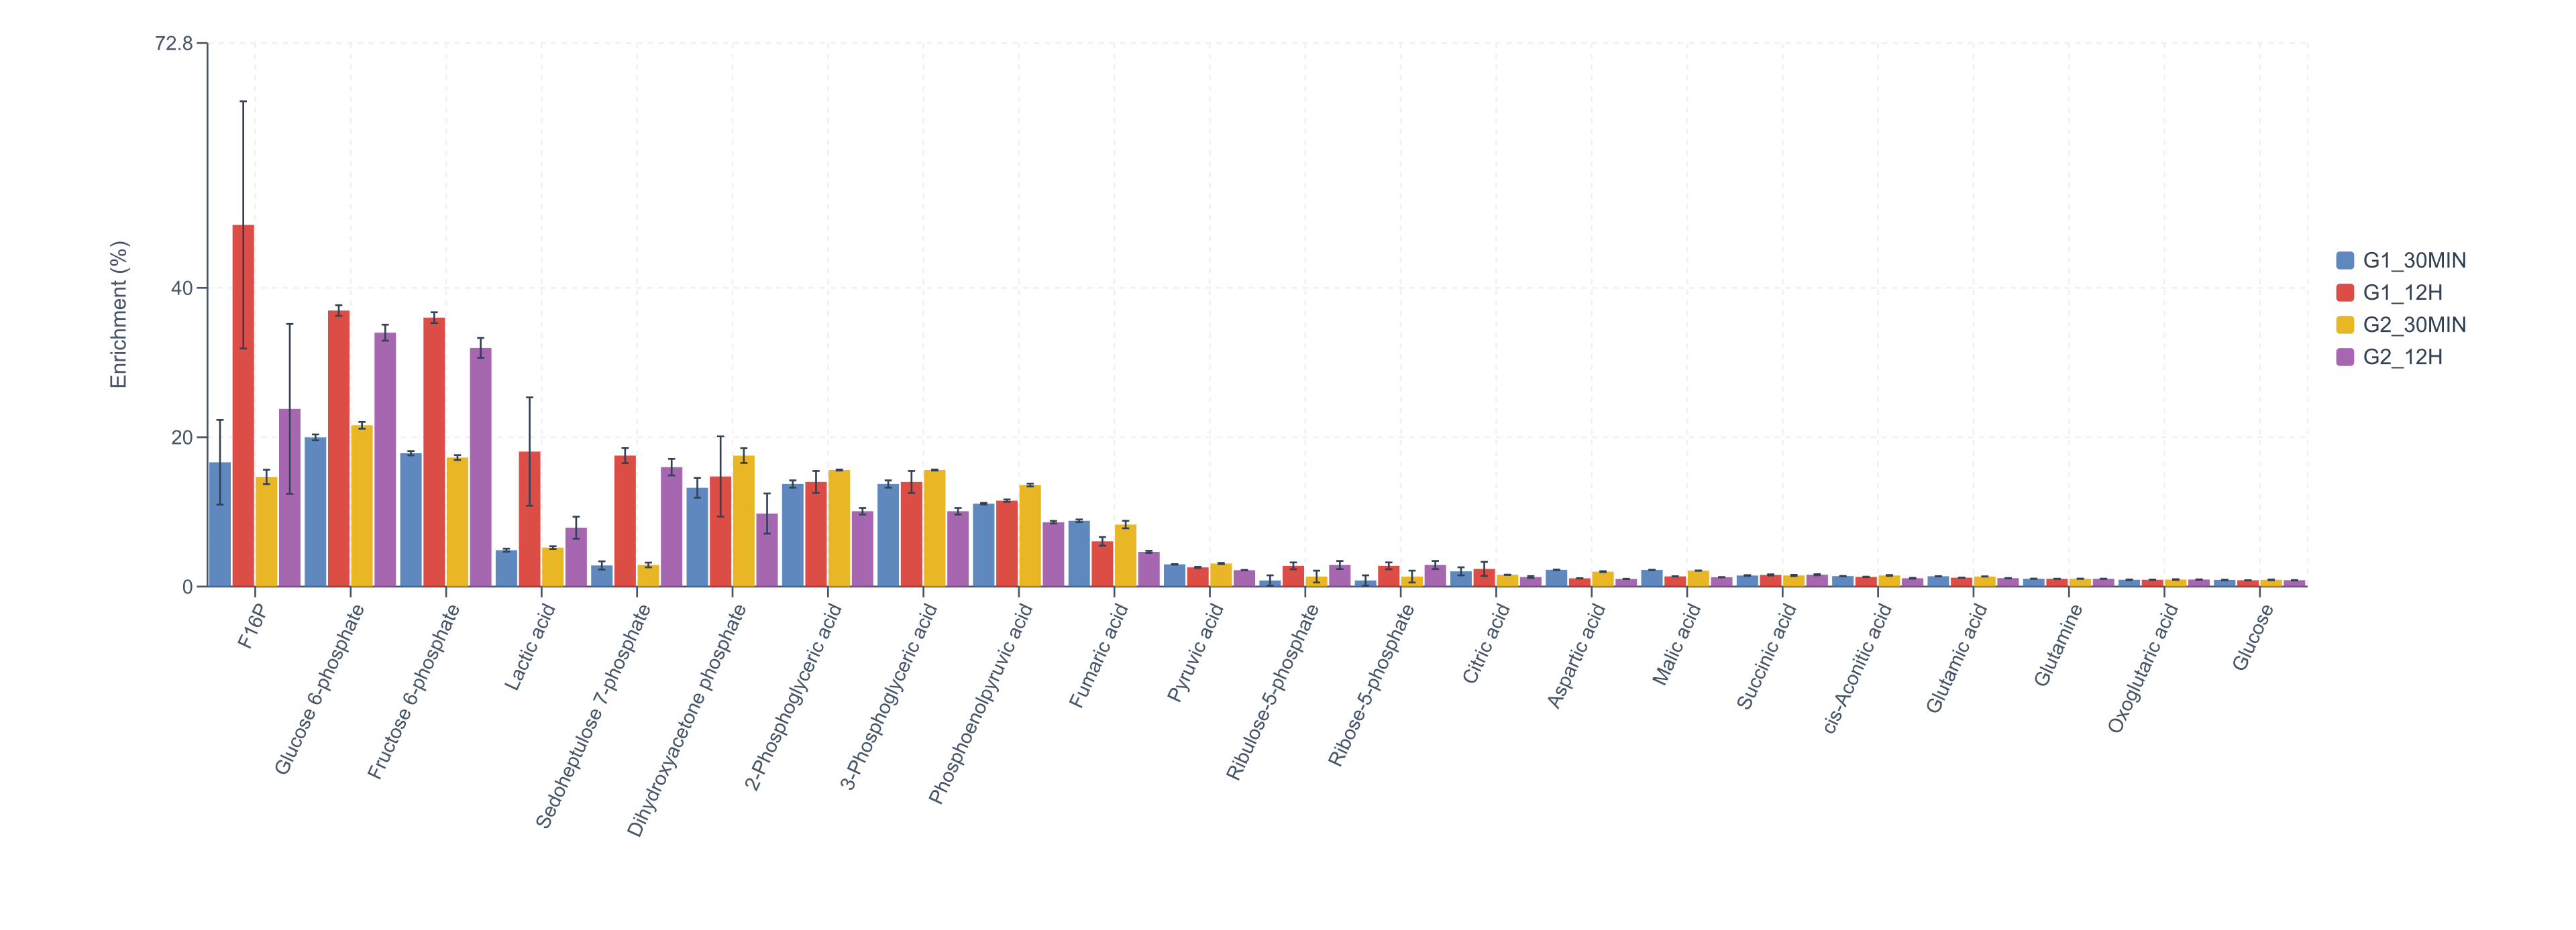
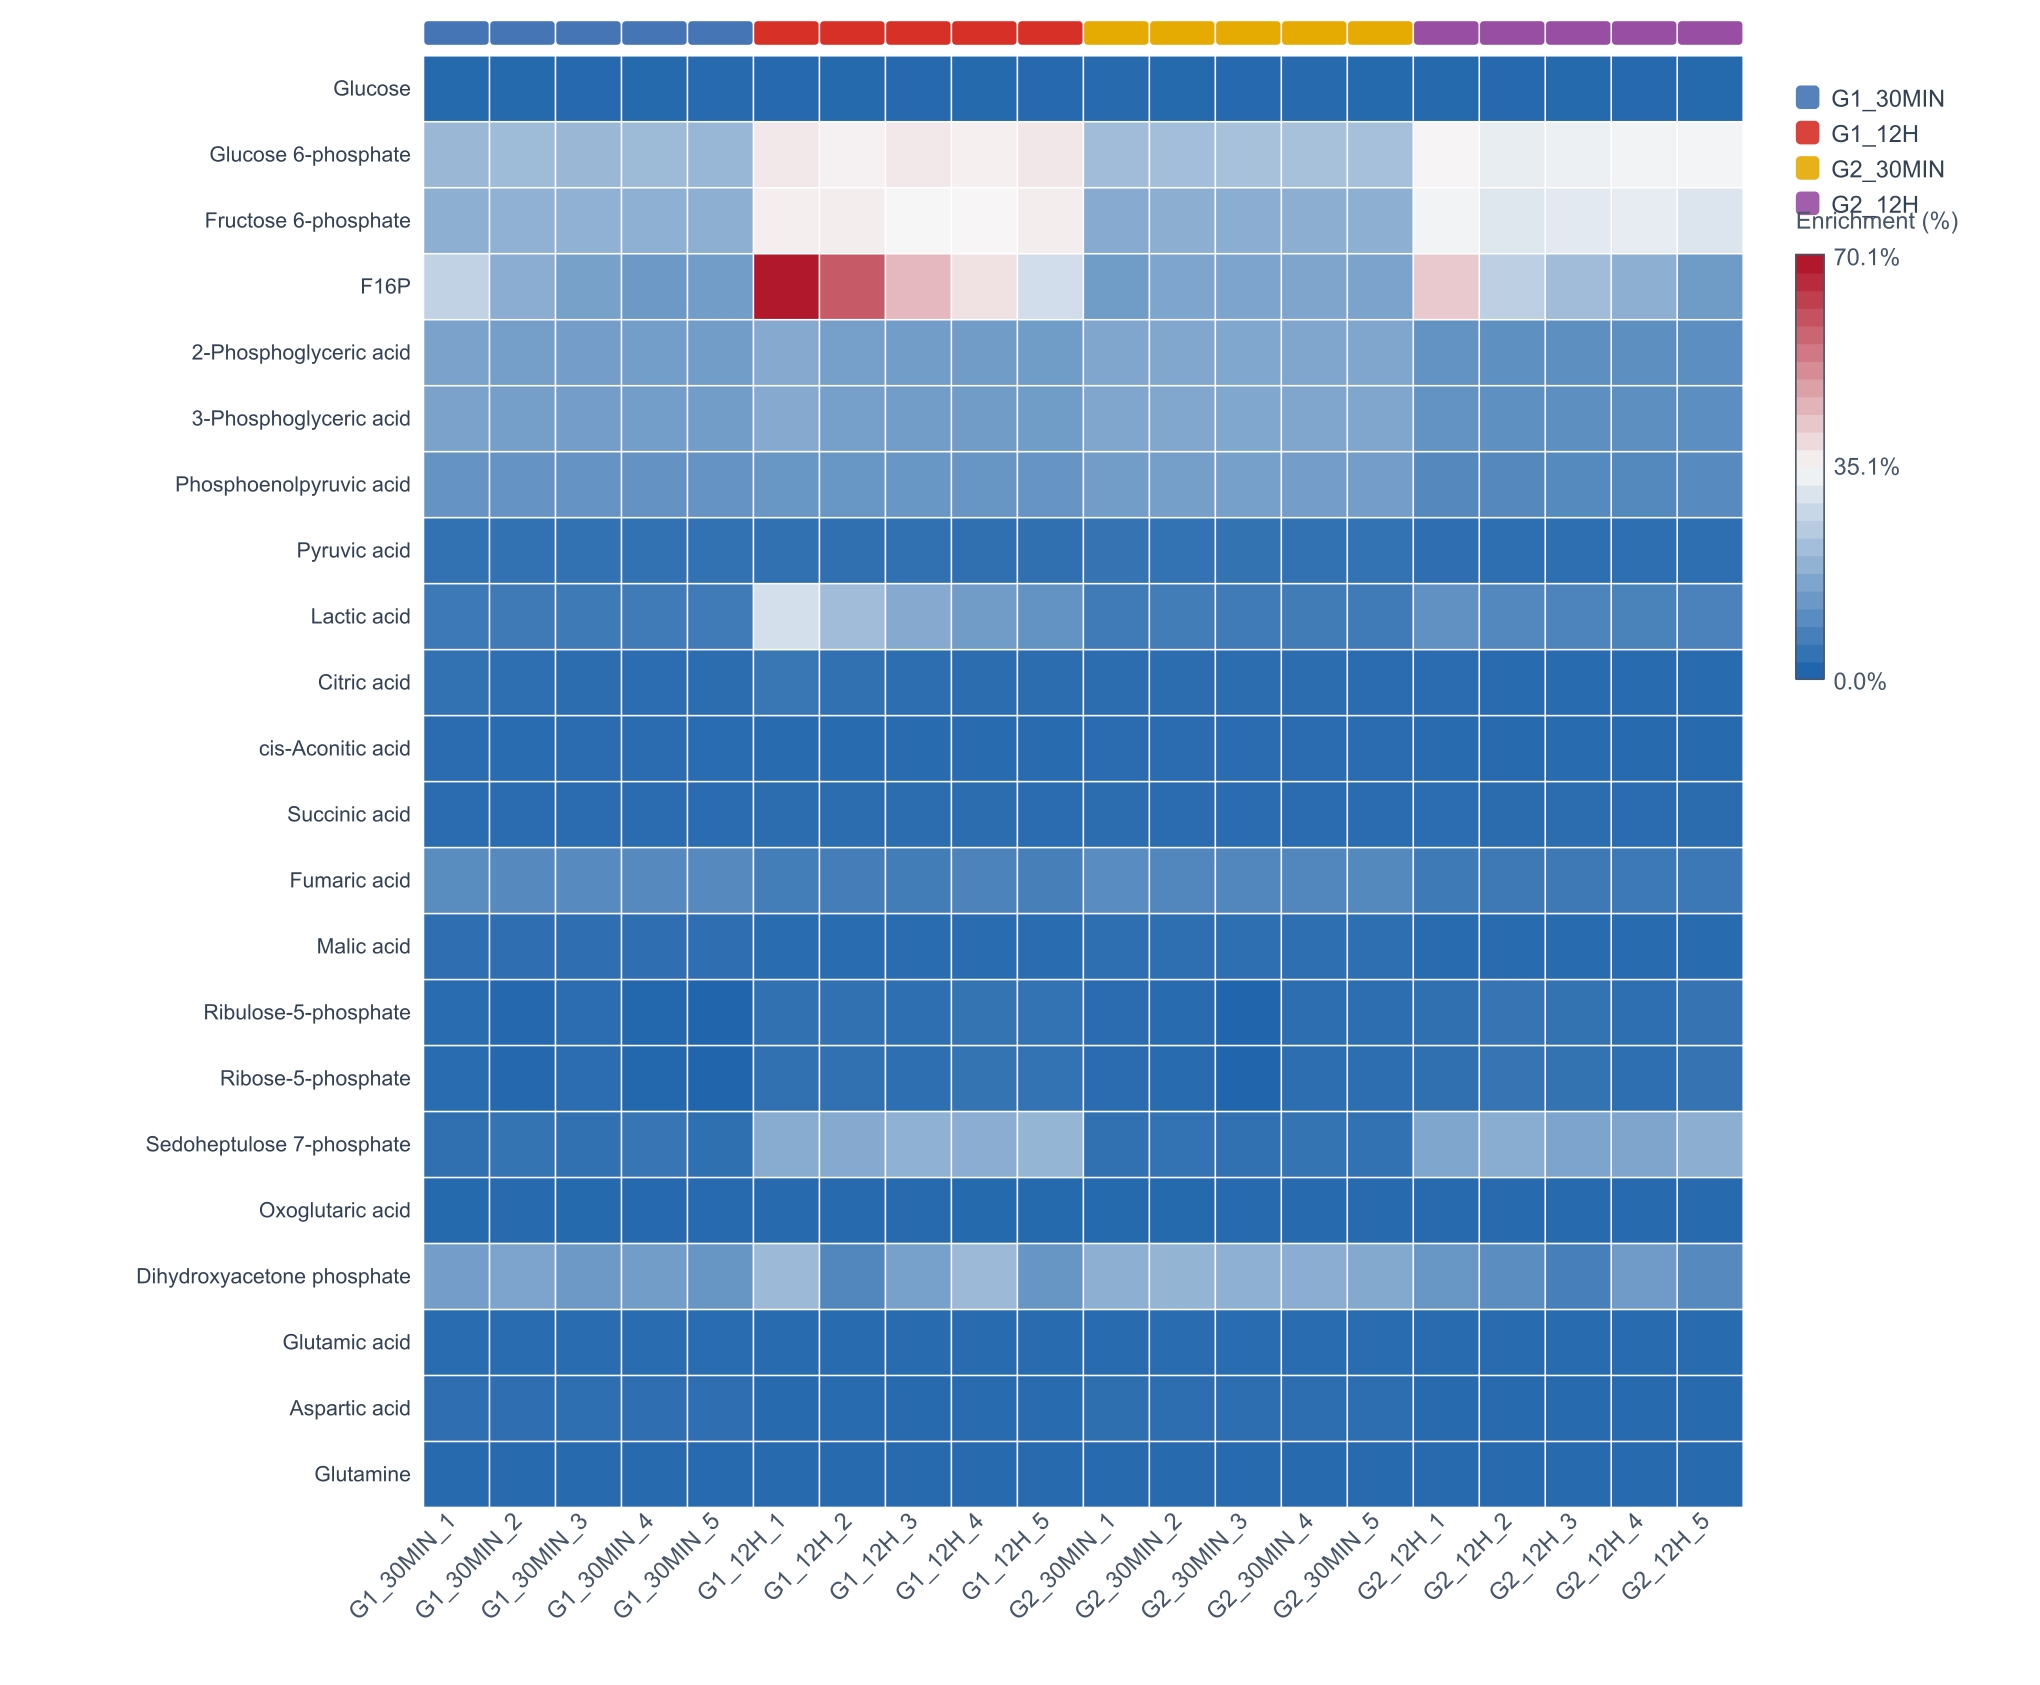
Labeling OverviewLabeling rate (enrichment) = weighted mean labeling across m+ isotopologues; group-mean comparison and inter-sample correlation matrix — labeling-rate heatmap, group-mean bar charts
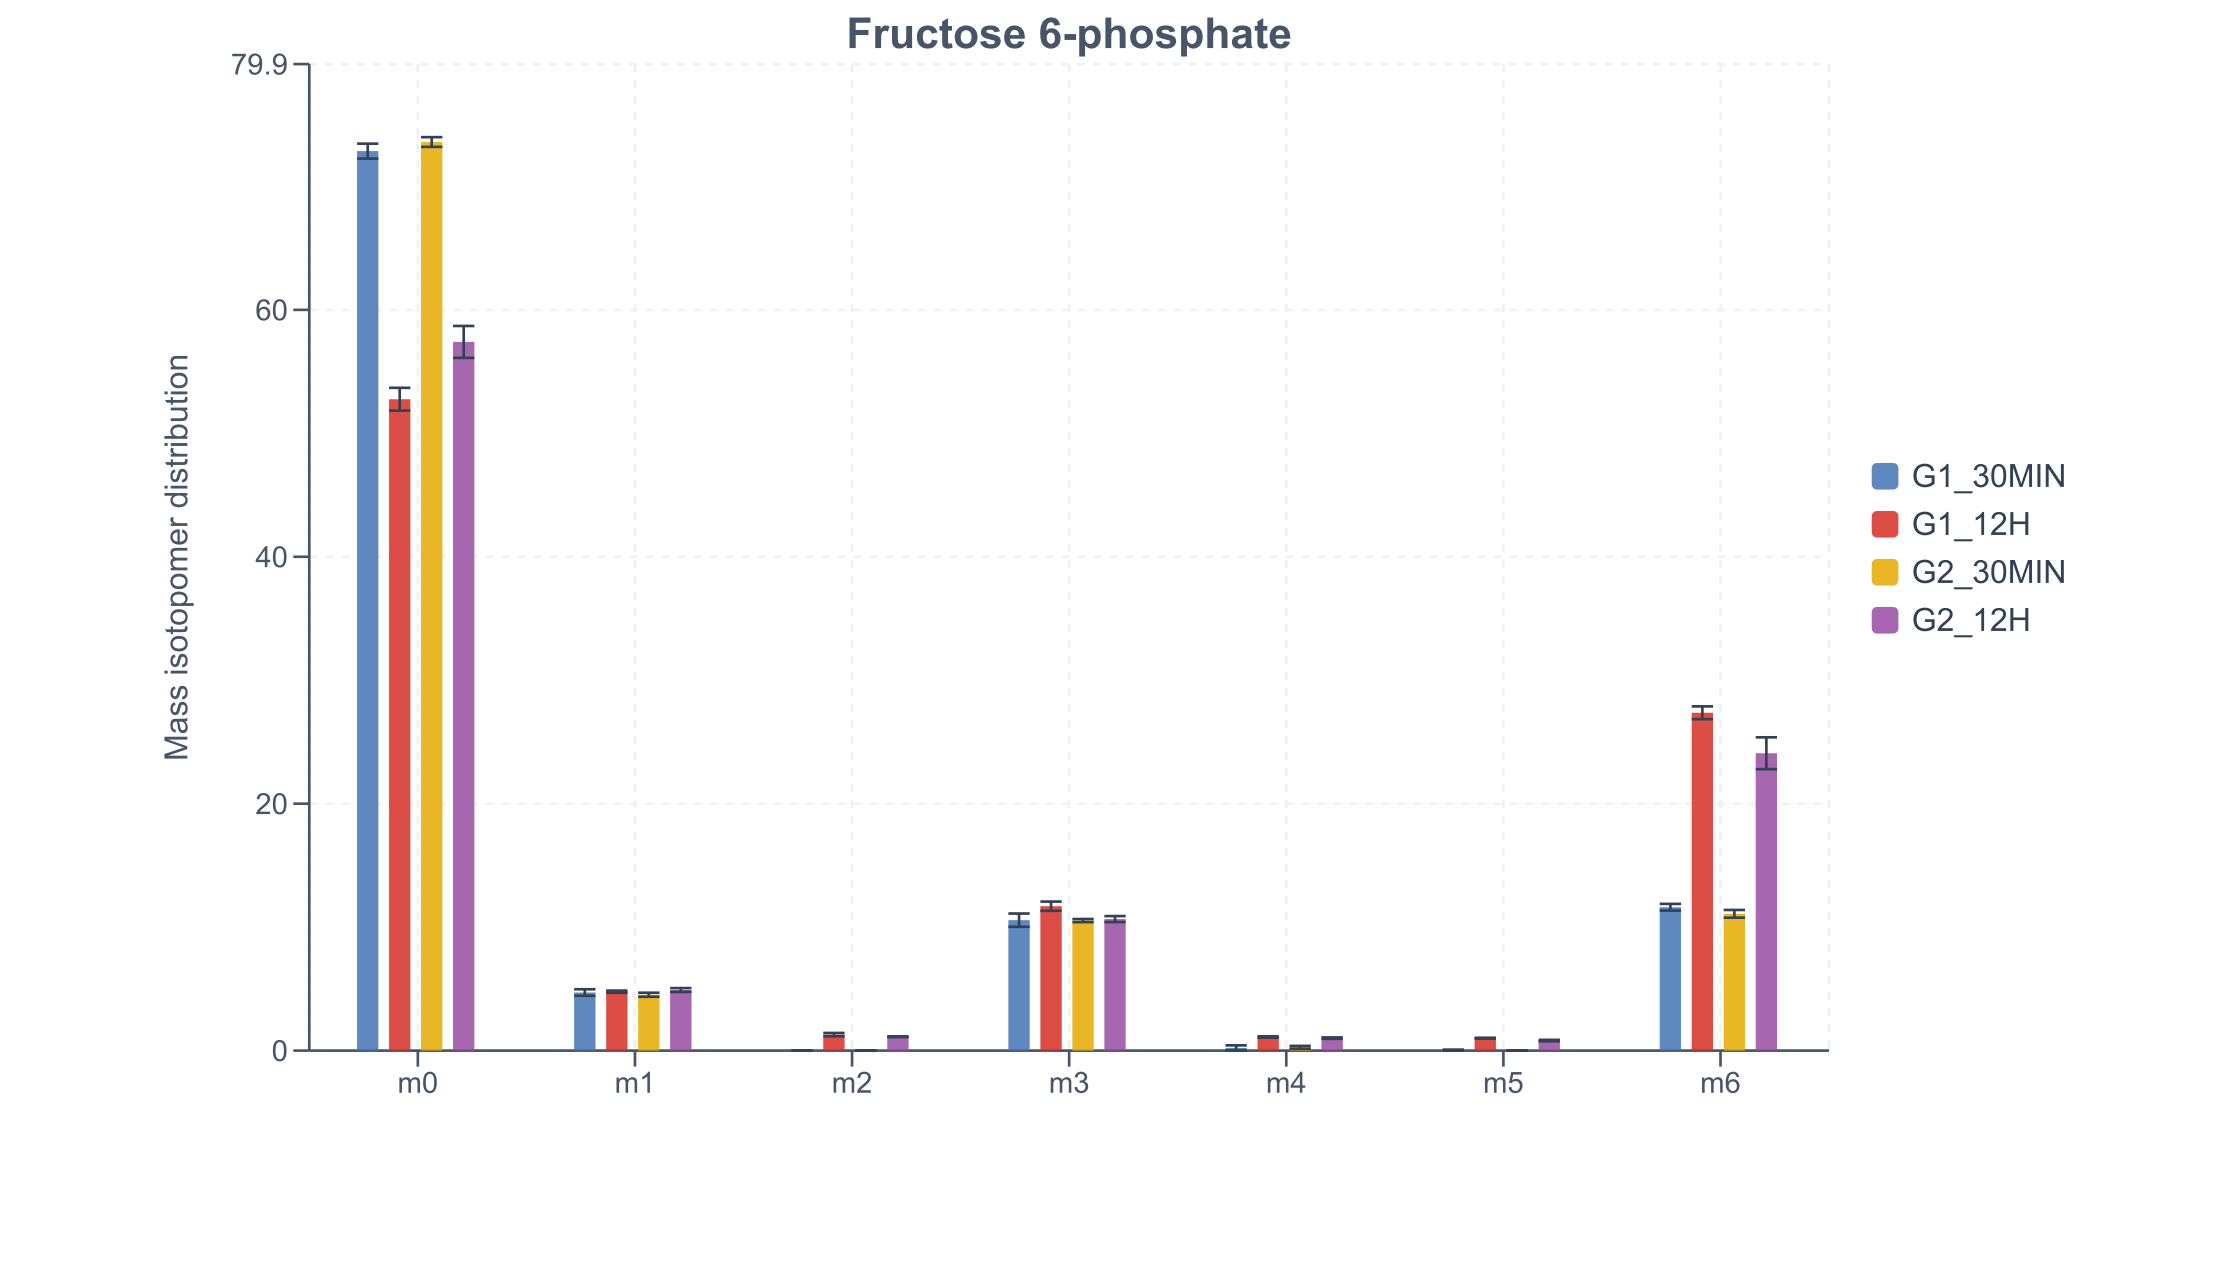
MID CompositionInter-sample isotope-ratio distributions, intra-sample m+ distributions, group MID composition comparison (mean ± SD) — distribution plot sets, MID composition tables
Group Comparisons & Cross-Comparison SummaryIndependent statistics per comparison (labeling-rate differences, differential MIDs); cross-comparison summary heatmaps and Venn diagrams — differential labeled-metabolite lists and intersection lists

Example Results

SELECTED FIGURES FROM ACTUAL REPORTS
Calibration Residual (RMS) Bar Chart
Natural-abundance correction residuals per metabolite — smaller RMS indicates more reliable correction.
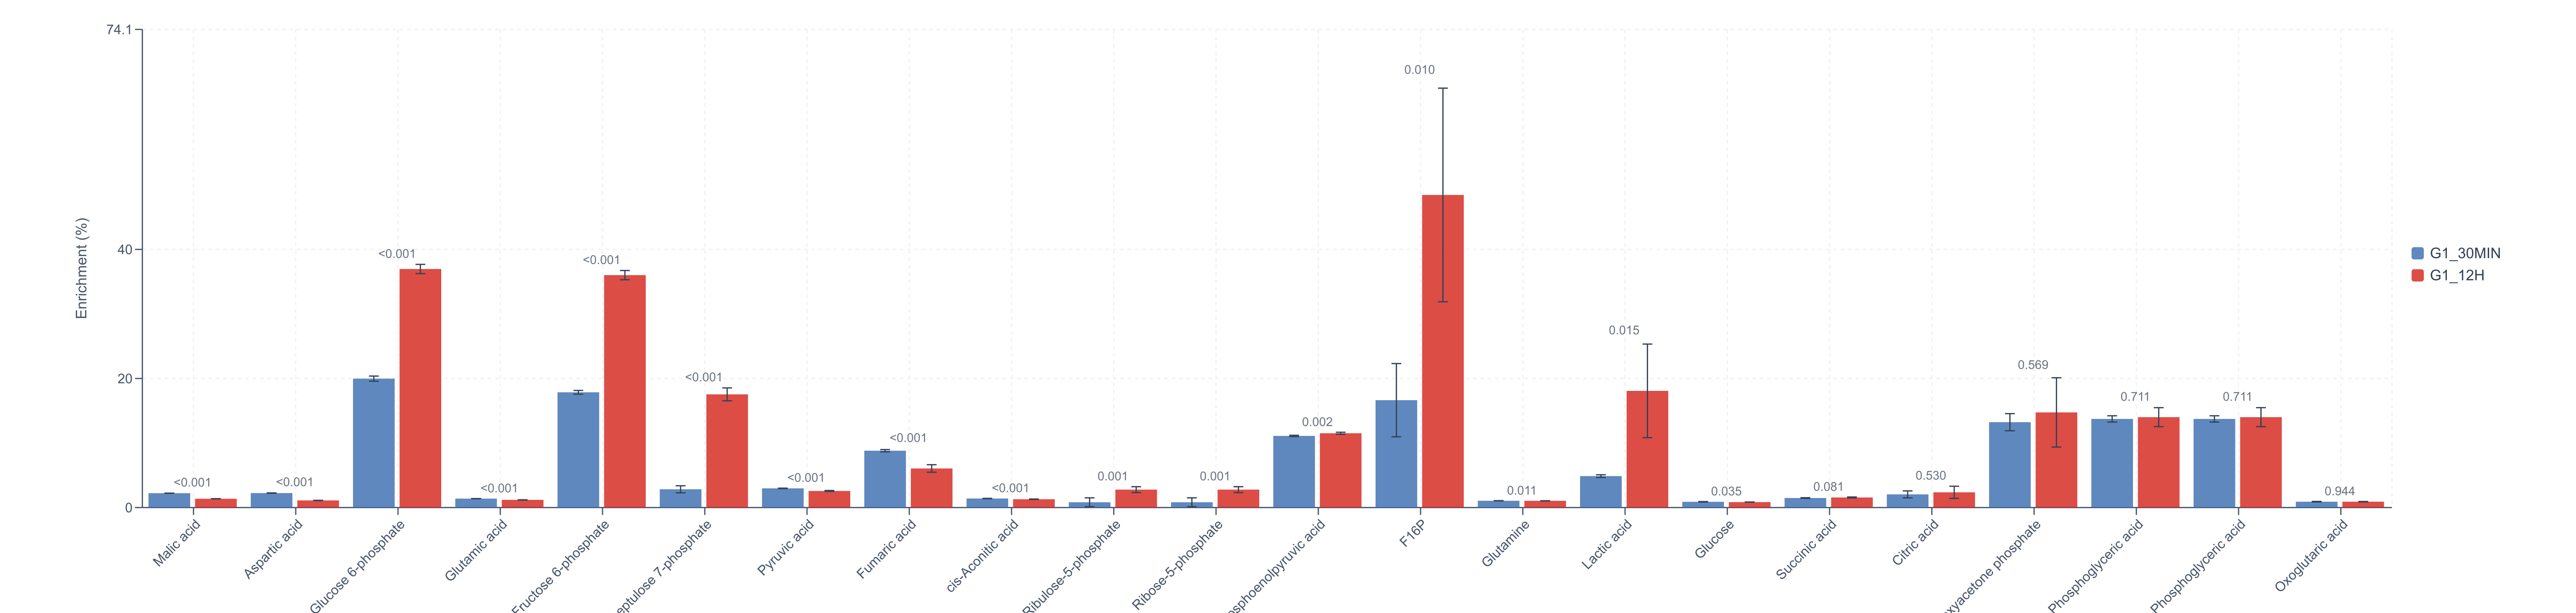
Group-Mean Labeling-Rate Bar Chart
Comparison of mean labeling rates (enrichment) across groups, outlining intergroup flux differences.
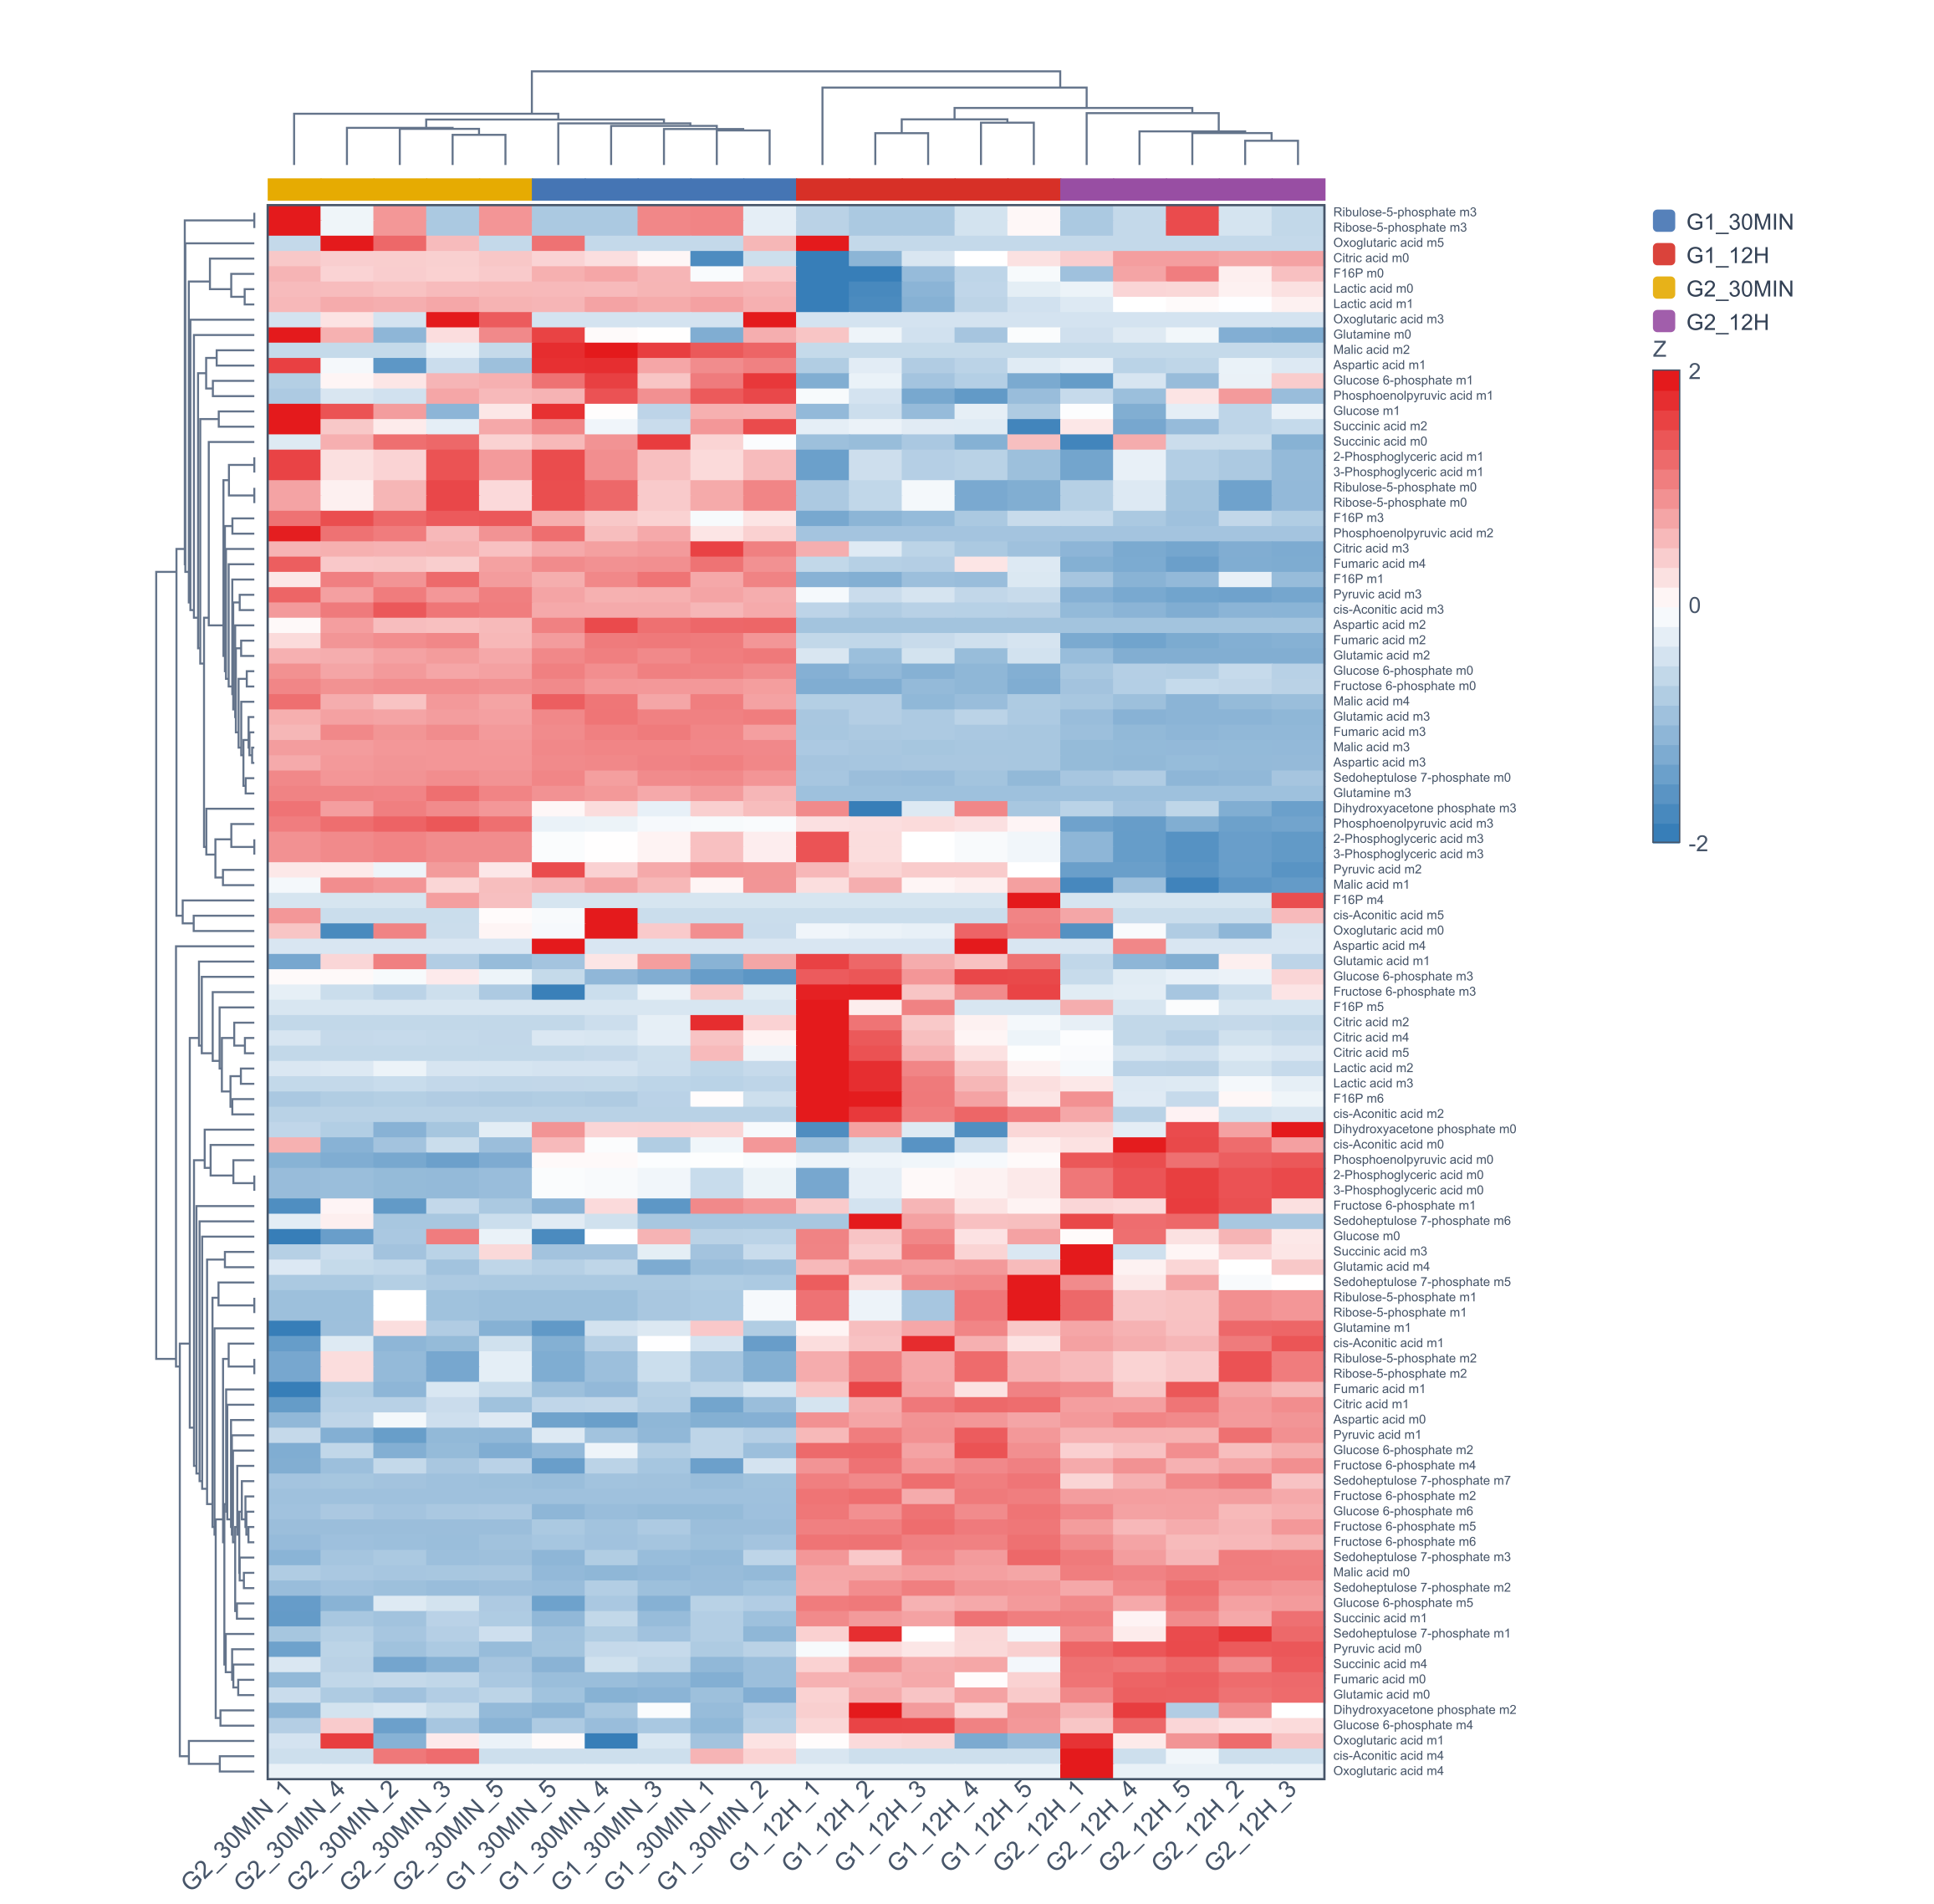
Differential MID Heatmap
Clustered heatmap of m+ fractions for differential metabolites; red/blue encodes direction and magnitude of labeling differences.
Labeling-Rate Heatmap
Metabolite × sample labeling-rate matrix for quickly locating highly labeled pathways and outlier samples.
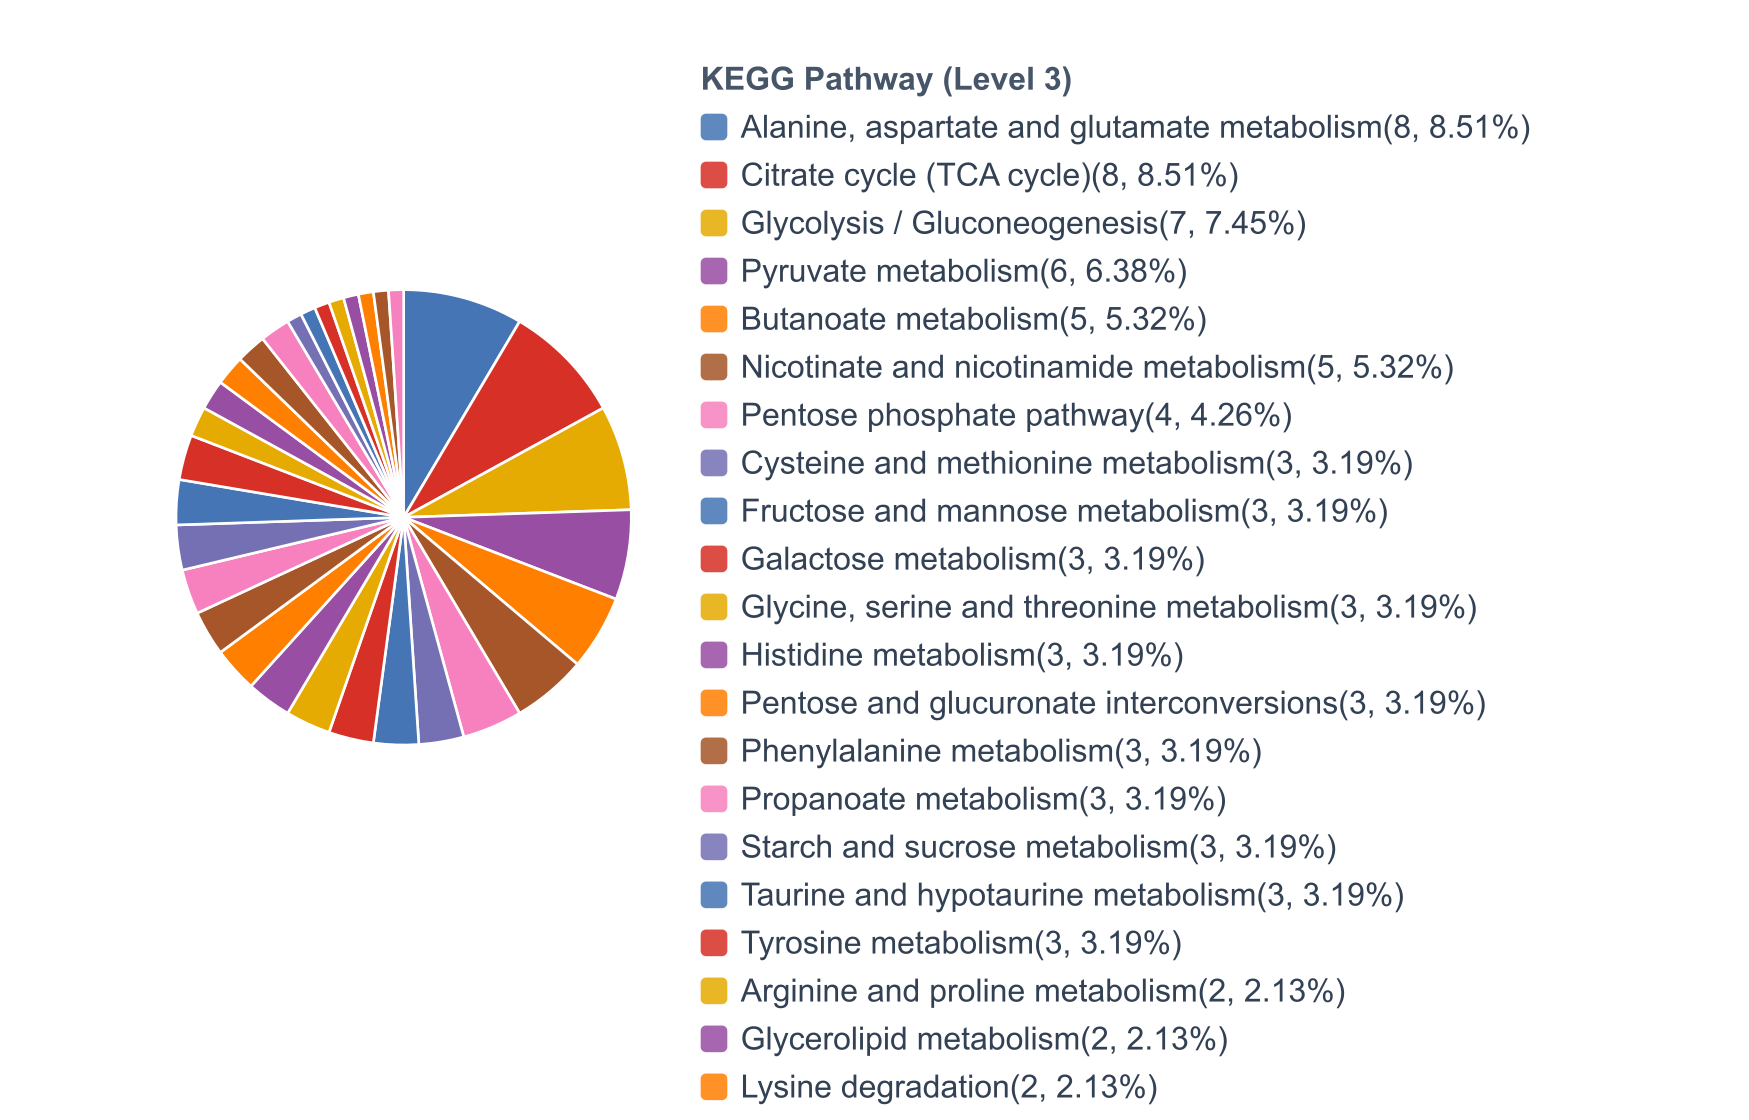
KEGG Pathway Proportion Analysis
KEGG level-3 pathway proportions of detected labeled metabolites, clarifying flux-coverage scope.
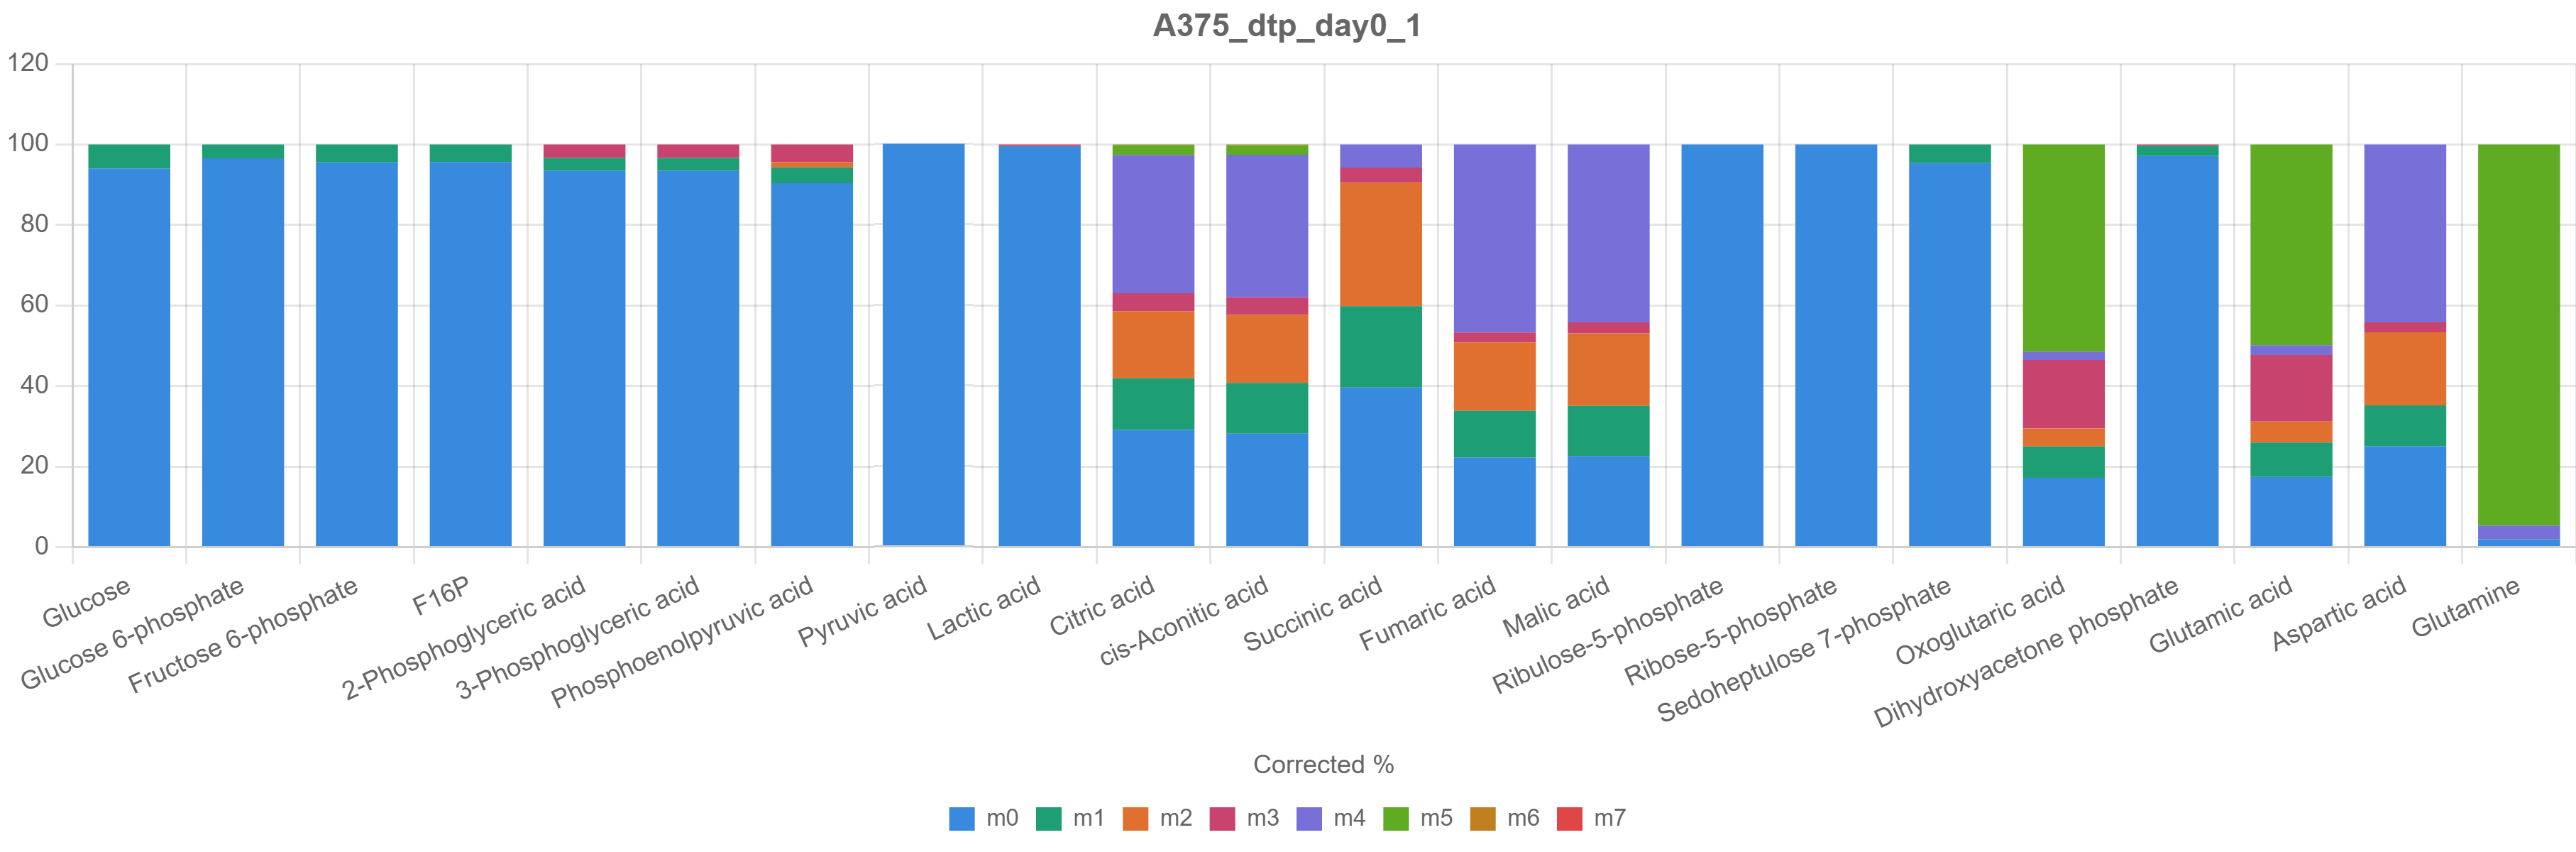
Intra-Sample Isotope Distribution
m+ composition of each metabolite within a single sample — the basic unit of readout.
Inter-Sample Isotope-Ratio Distribution
Distribution of m+ ratios across samples, assessing whether labeling has reached steady state.
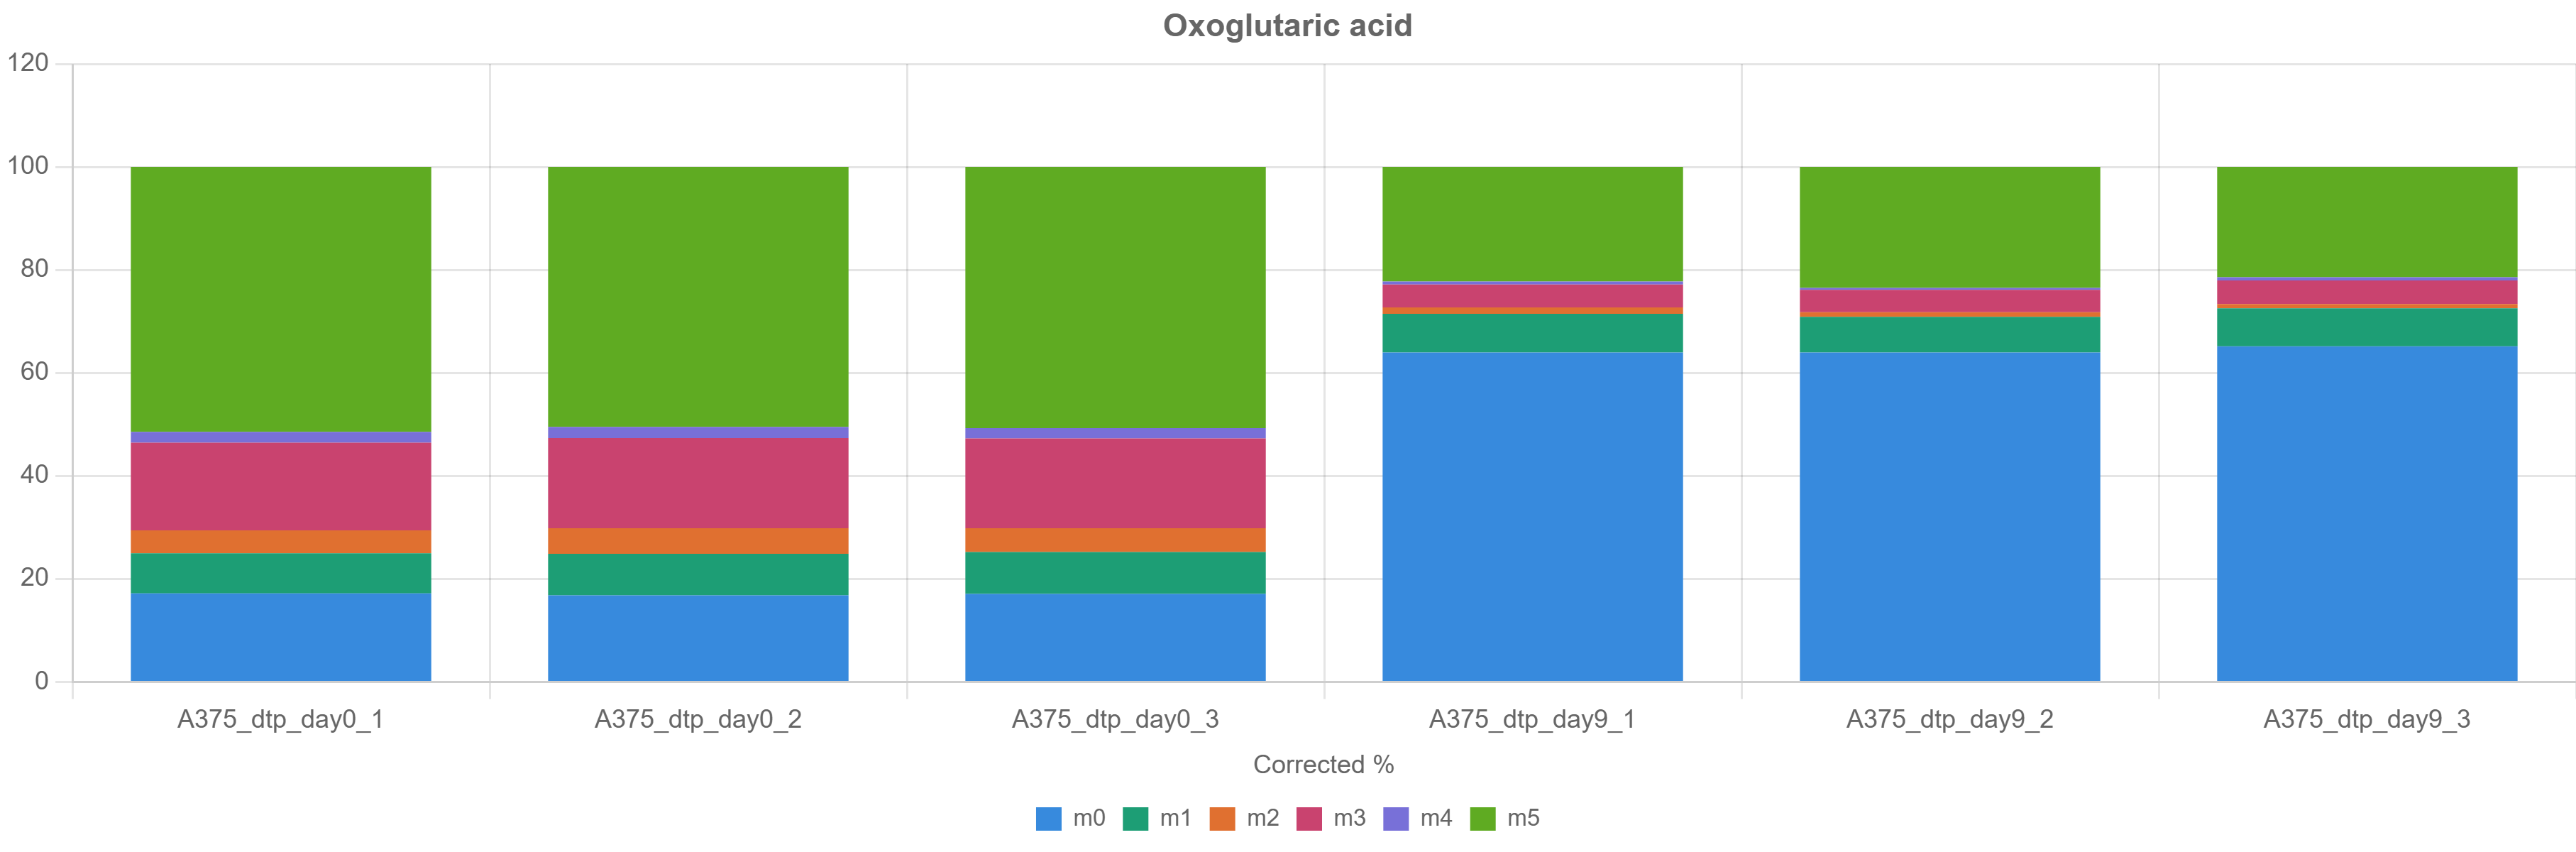
Group MID Composition Comparison
Stacked comparison of group MID means ± SD, comparing label propagation along pathways.
Labeling-Rate Difference Bar Chart
Labeling-rate differences and significance for specified comparisons, screening differential labeled metabolites.

Applications

APPLICATIONS
Tumor Metabolic ReprogrammingGlycolysis / TCA Cycle FluxIsotope-Tracer Fate MappingCellular Energy MetabolismDrug Metabolism Mechanisms

FAQ

FAQ
How long does a Metabolic Flux & Isotope Tracing project take?
Mature targeted panels typically take 1-3 weeks; untargeted projects take 2-4 weeks (counted from sample receipt and QC approval). The exact timeline is confirmed in writing before project start, and progress is trackable on the OmicsHub cloud platform.
What if my sample amount is below the recommendation?
Please do not dilute your samples. Low-input samples can often be accommodated by adjusting the preparation workflow — tell us the actual amount and our technical team will assess feasibility and note adjustments in the study plan.
Can I add targets to an existing panel?
Yes. Mature panels support on-demand additions; novel analytes outside the list can be implemented through custom method development (requires standards and extra validation time) — see our Custom Targeted Metabolomics service.
What samples do you need for Metabolic Flux & Isotope Tracing?
Serum/plasma ≥100 μL (fasting, no haemolysis), tissue ≥50 mg (snap-frozen), cells ≥1×10⁶ (medium washed off), urine ≥200 μL. Keep fasting time consistent, aliquot into single-use volumes and avoid freeze–thaw. Full guidance: Technical Resources → Sample Guide.

Delivery timing: sample shipping, customs declaration and similar steps may extend turnaround; actual project timelines prevail.

Request a Quote or Study Design

Tell us about your project — we reply within one business day (free assessment)

Used only for this enquiry; never shared.

Start Your Multi-omics Project

Free study design · Interactive execution · In-depth data interpretation

Official Channels
OFFICIAL CHANNELS
WeChat Official Account QR
Official Account
WECHAT OFFICIAL ACCOUNT
WeChat QR
WeChat Service
CUSTOMER SERVICE
Xiaohongshu QR
Xiaohongshu
XIAOHONGSHU
Call us:400-660-8826
WeChat QR
Scan to chat on WeChat