16S AMPLICON SEQUENCING

Amplicon Sequencing

16S / 18S / ITS Amplicon Sequencing — Microbial Diversity & Community Profiling

Amplicon sequencing targets specific regions of microbial marker genes — 16S rRNA (bacteria/archaea), 18S (eukaryotic microbes) and ITS (fungi) — for high-throughput sequencing, profiling community structure without isolation or culture. After QC, OTU clustering and taxonomic annotation, we perform community composition, alpha/beta diversity and intergroup differential analyses, with PICRUSt2 functional prediction supported.

PE250
Illumina MiSeq Paired-end
PAIRED-END 250 bp
50,000
reads / sample
READS PER SAMPLE
8
Analysis Modules
ANALYSIS MODULES

Technical Specifications

TECHNICAL SPECIFICATIONS
ItemDetails
Sequencing PlatformIllumina MiSeq PE250(16S / 18S / ITS)
Analysis StrategyOTU / ASV analysis, 50,000 reads per sample
Taxonomy DatabasesRDP classifier Bayesian algorithm; reference databases Silva 138 (16S/18S) and Unite 7.0 (ITS); community composition statistics across 7 ranks (domain to species)
Functional PredictionPICRUSt2 predicts functional abundance from marker genes (KEGG orthologs KO, EC enzyme classes)
Standard DeliveryRaw data + analysis report

Analysis Workflow

ANALYSIS WORKFLOW
1
Data QC
PE merging · filtering
2
OTU Clustering
Dereplication · chimera removal
3
Taxonomy Annotation
RDP · Silva 138
4
Composition
Venn · Bar · heatmap
5
Alpha Diversity
Rarefaction · indices
6
Beta Diversity
PCoA · NMDS
7
Differential Taxa
LEfSe · rank-sum tests
8
Functional Prediction
PICRUSt2 · KEGG

Bioinformatics Analyses

BIOINFORMATIC MODULES
ModuleCore Methods & MetricsKey Outputs
Data QCPE reads merged by overlap; sequences are quality-controlled, filtered and demultiplexed before clustering/denoising and taxonomic analysisFiltering statistics table, base-quality distribution plots
OTU ClusteringNon-redundant sequences extracted and singletons removed; OTUs clustered at 97% similarity with chimera removal during clusteringOTU abundance table, annotated OTU table, taxon statistics table
Taxonomy AnnotationTaxonomic annotation with the RDP classifier Bayesian algorithm; Silva 138 (16S/18S) and Unite 7.0 (ITS) reference databases; composition statistics across 7 ranks (domain/kingdom/phylum/class/order/family/genus/species)Absolute / relative abundance tables at each taxonomic rank
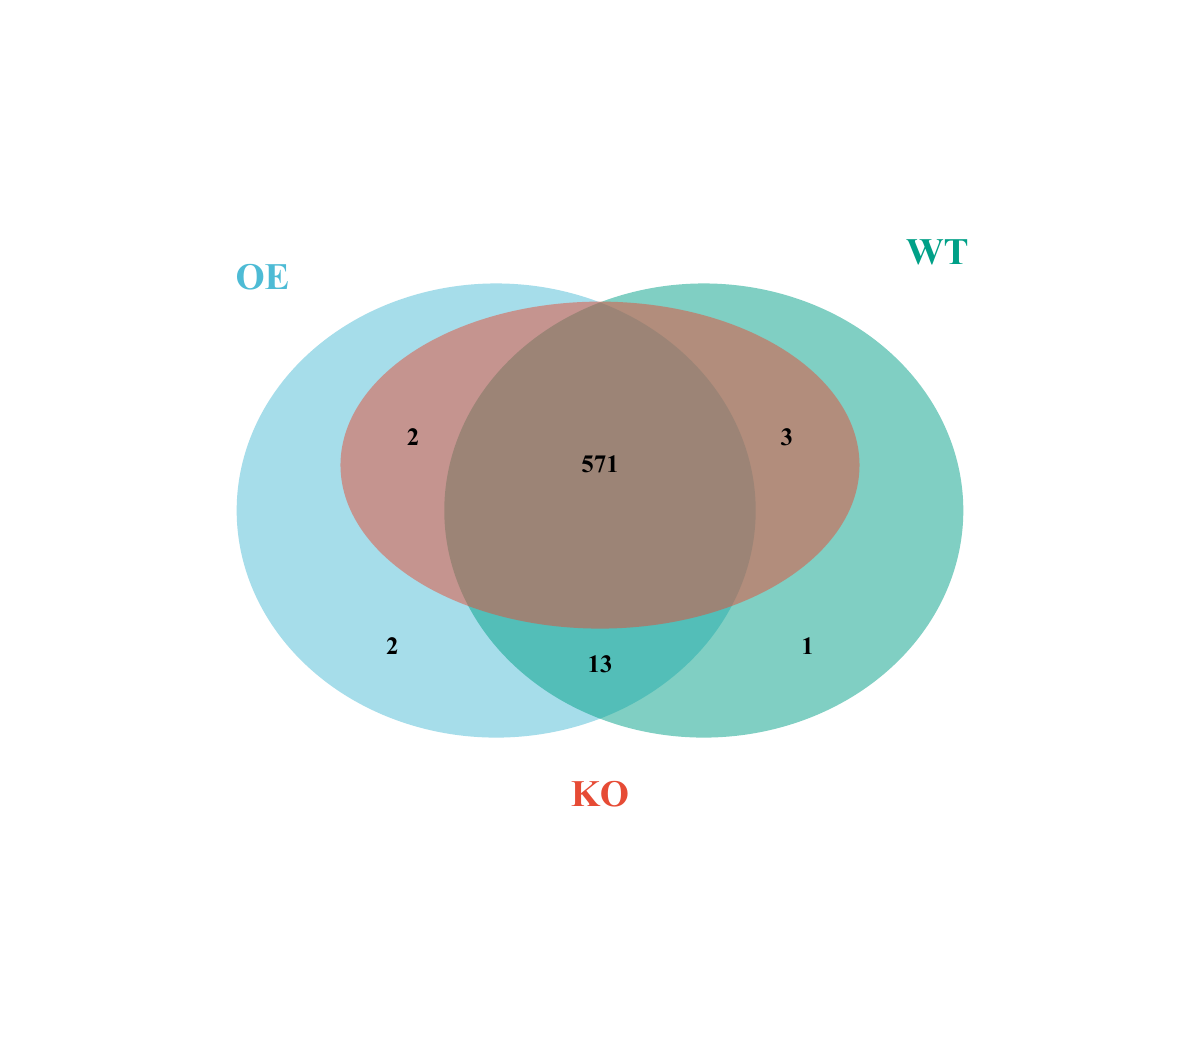
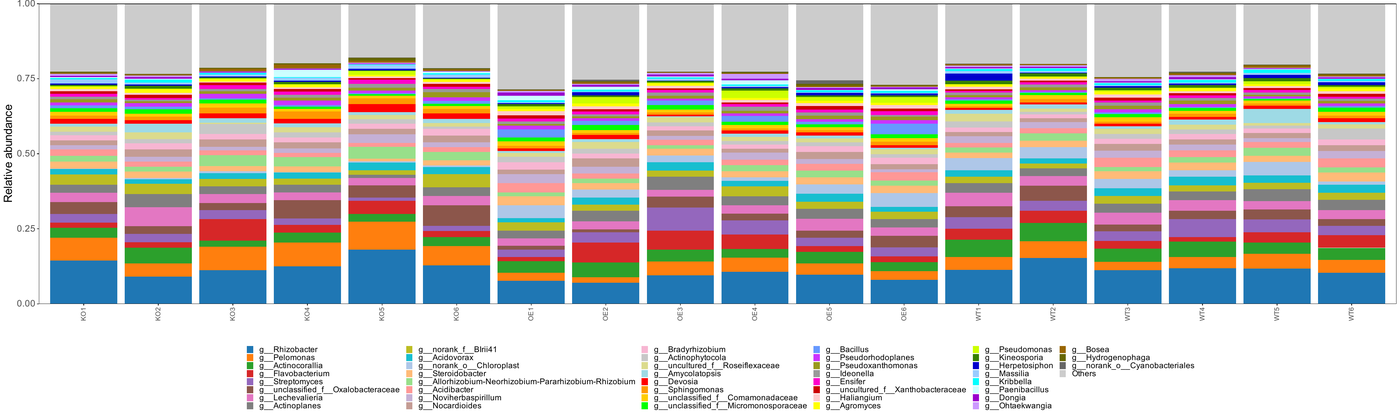
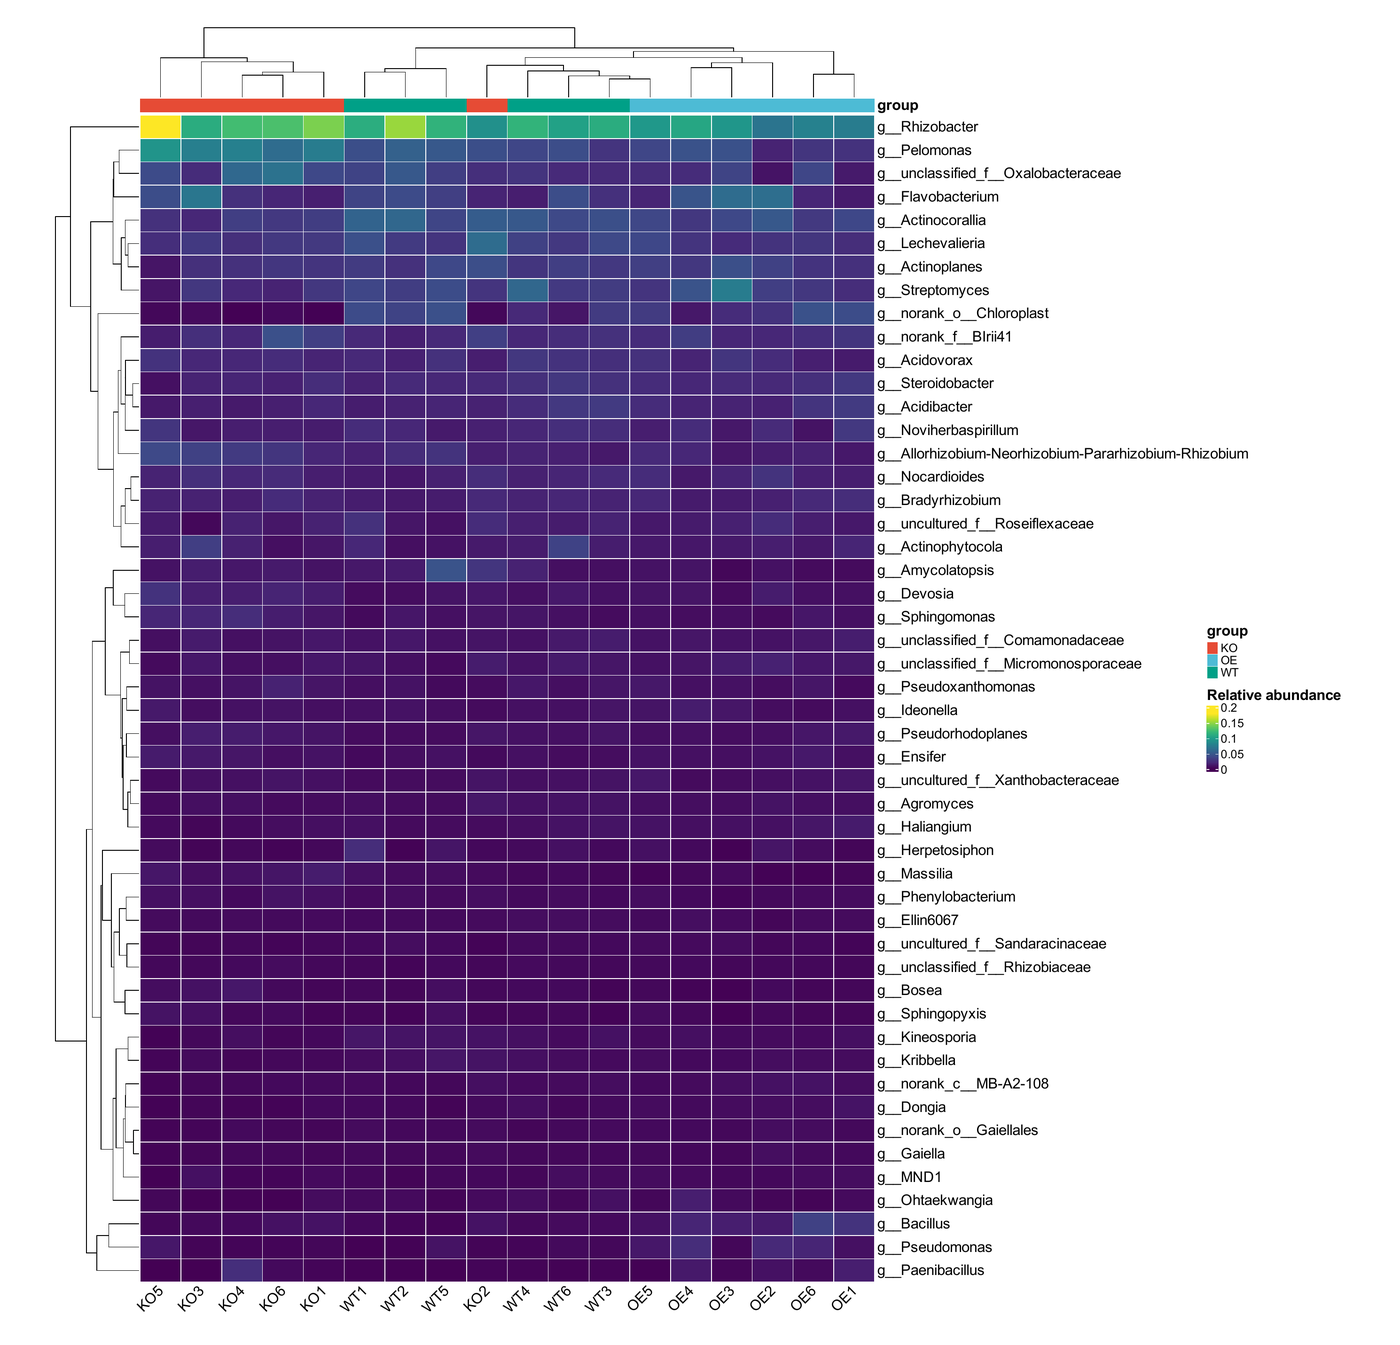
CompositionShared and unique OTU statistics between groups; community bar plots at each taxonomic level; abundance heatmap with two-way clustering of taxa and samplesVenn diagram, community bar plots, heatmap
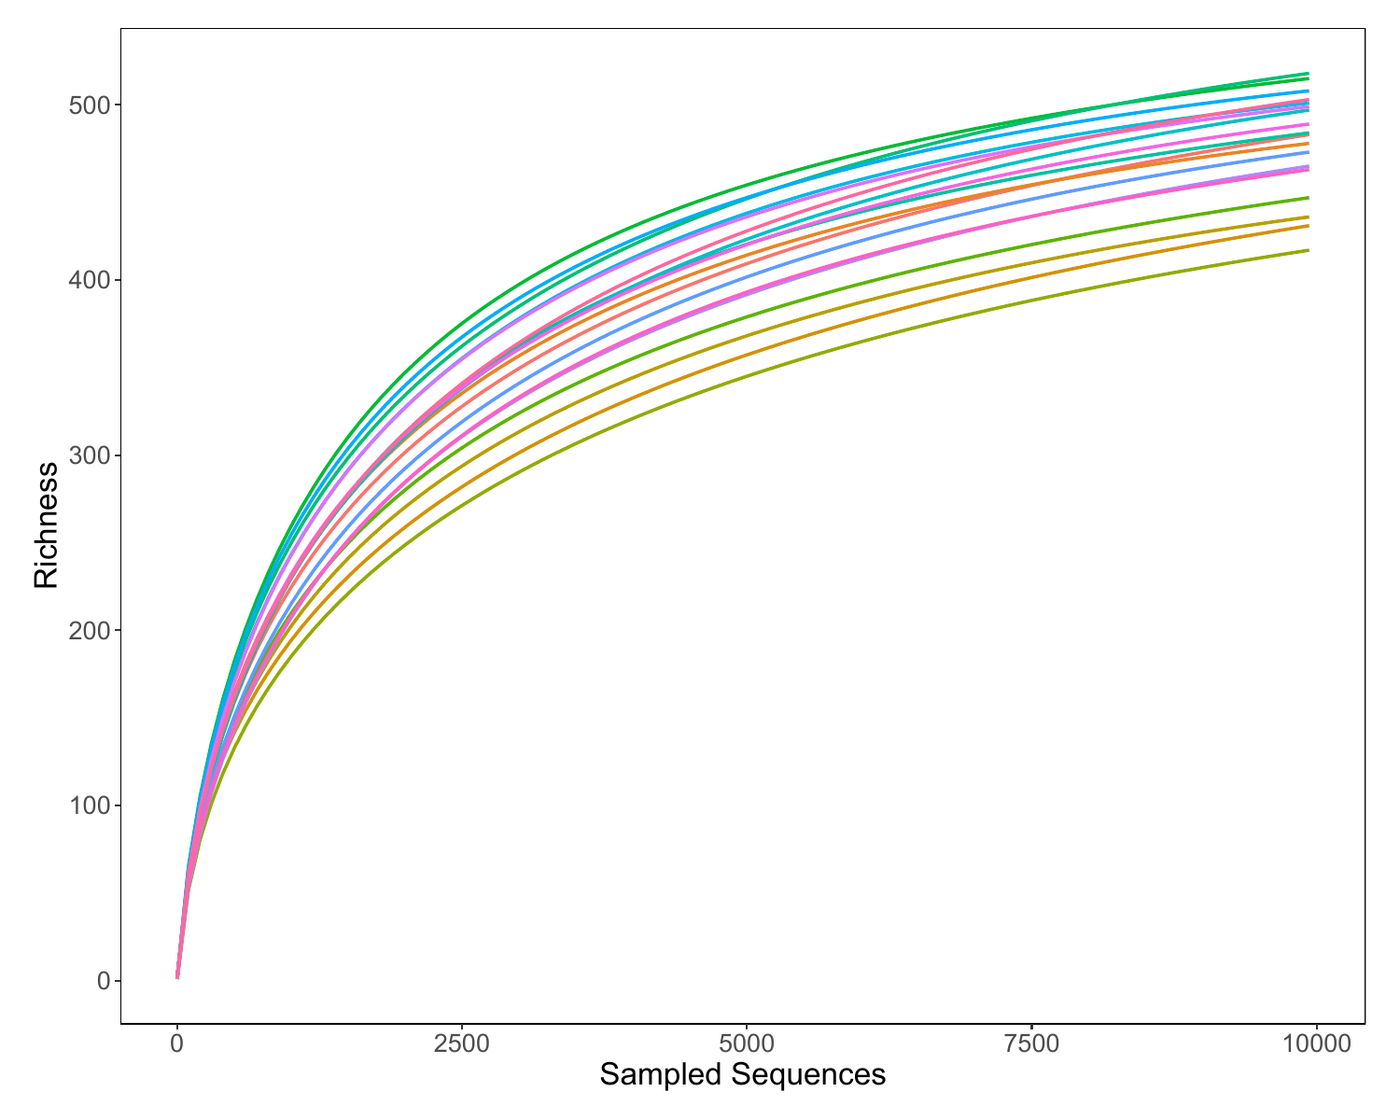
Alpha DiversityRichness (Chao1/Ace), diversity (Shannon/Simpson), evenness (Pielou), phylogenetic diversity (PD) and coverage; rarefaction, Shannon-Wiener and rank-abundance curvesThree curve plots, intergroup boxplots of indices and test tables
Beta DiversityInter-sample distance matrices (Bray-Curtis / Jaccard / UniFrac); UPGMA hierarchical clustering; PCA / PCoA / NMDS ordination; ANOSIM / adonis intergroup testsDistance-matrix heatmap, clustering tree, PCA / PCoA / NMDS plots
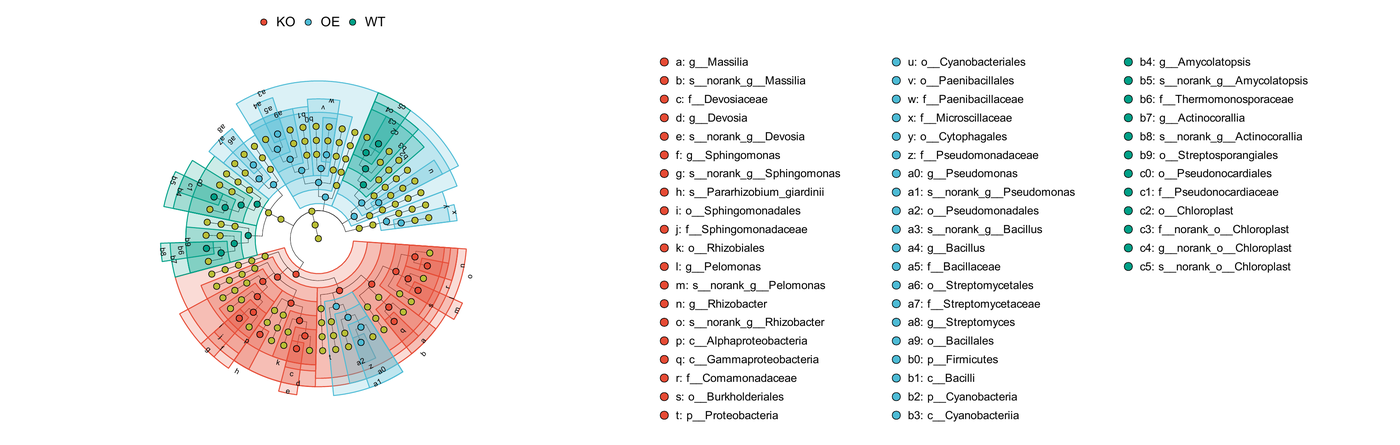
Differential Taxa AnalysisLEfSe linear discriminant analysis effect size (LDA scores); Wilcoxon rank-sum test for two groups and Kruskal test for multiple groups to identify significantly enriched taxaLEfSe cladogram, LDA bar chart, differential test tables
Functional PredictionPICRUSt2 prediction of functional abundance from marker genes (KEGG orthologs KO, EC classes); PCoA of functional units; LEfSe and MetagenomeSeq differential analysis of KEGG / MetaCyc pathwaysFunctional abundance tables, functional PCoA plot, pathway LEfSe plots

Example Results

SELECTED FIGURES FROM ACTUAL REPORTS
Shared / Unique OTU Venn Diagram
Shared and unique OTUs across KO / OE / WT groups; numbers in overlapping areas indicate shared features.
Community Composition Bar Plot (Genus Level)
Relative genus-level abundance per sample; low-abundance taxa grouped as 'other'.
Taxon Abundance Heatmap (Genus Level)
Abundance distribution of top genera across samples, with two-way hierarchical clustering of taxa and samples.
Rarefaction Curve
Rarefaction Curve
Observed taxa versus randomly sampled sequences, assessing whether sequencing depth is sufficient.
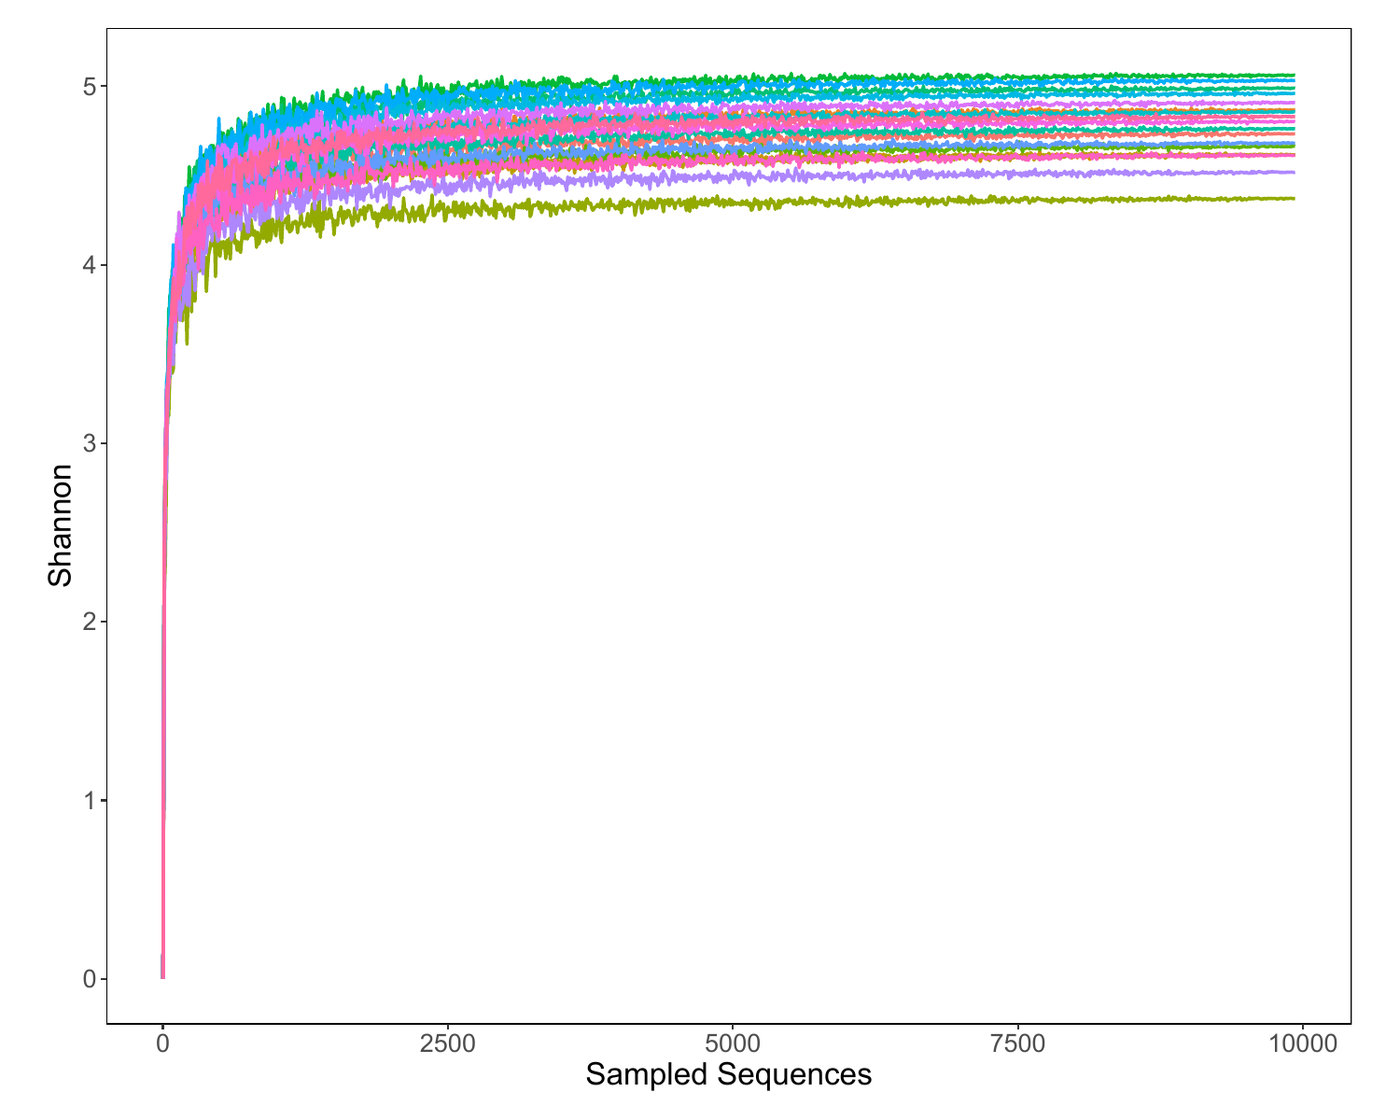
Shannon-Wiener Curve
Shannon diversity index at increasing sequencing depths; a plateau indicates sufficient data volume.
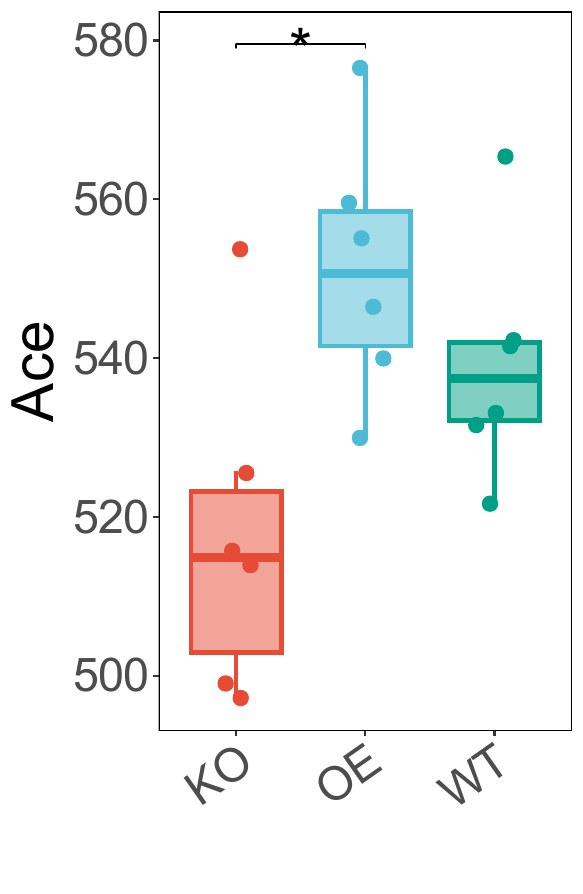
Alpha Diversity Intergroup Boxplot
Distribution and significance testing of the Ace richness index across groups, with significance markers.
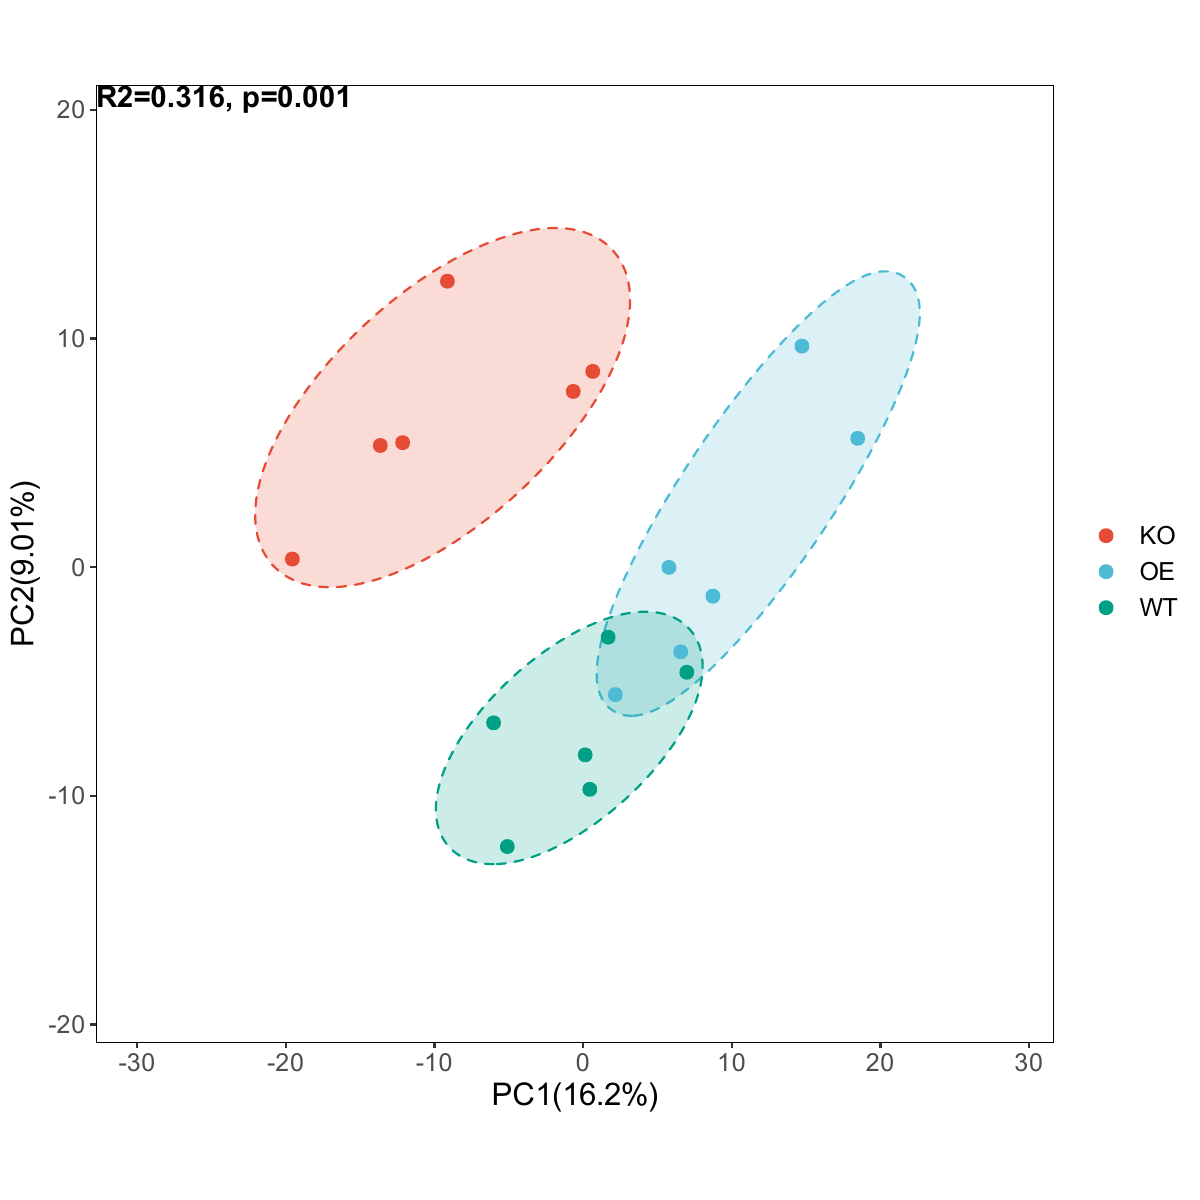
PCA (OTU Level)
PCA (OTU Level)
Principal-component score plot of community-structure differences, annotated with R² and test p-values.
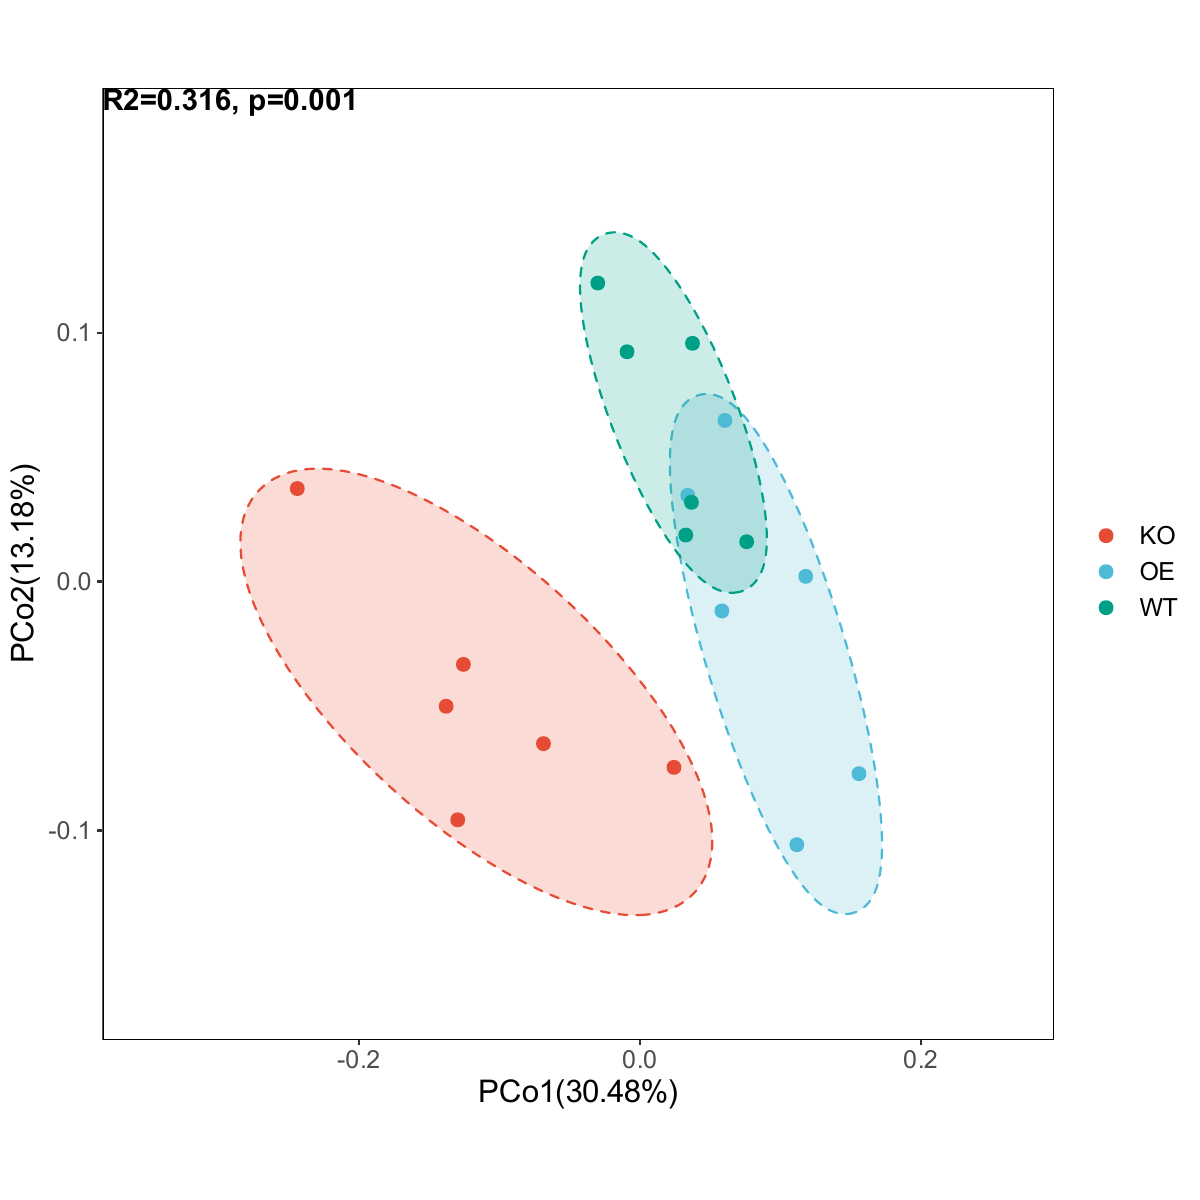
PCoA (Bray-Curtis)
PCoA (Bray-Curtis)
Principal coordinates analysis on distance matrices; confidence ellipses show intergroup structural differences.
LEfSe Cladogram
LEfSe Cladogram
Taxonomic distribution of significantly different taxa between groups; colors indicate the enriched group.

Applications

APPLICATIONS
Gut Microbiota ProfilingEnvironmental Microbial DiversityFermentation Microbiome MonitoringPlant Rhizosphere MicrobiomeMicrobiome-Metabolome Integration

FAQ

FAQ
How long does a Amplicon Sequencing project take?
From sample QC approval, standard timelines are 3-6 weeks (library prep, sequencing and bioinformatics included); large cohorts or deep custom analyses follow the confirmed study plan.
What if my samples fail QC?
Failed QC is reported immediately with reasons, and we discuss resampling or plan adjustments with you — sequencing never proceeds without qualification.
What bioinformatics is included? Can I add custom analyses?
Standard delivery covers QC, mapping/assembly, quantification, differential and functional enrichment analyses. Custom deep-dive and multi-omics integrative analyses are supported on request.
What samples do you need for Amplicon Sequencing?
Total RNA ≥1 μg with RIN ≥7 (snap-frozen, dry ice); microbial and faecal samples ≥200 mg (sterile, −80 °C); whole blood for WGS ≥500 μL (EDTA only, never heparin). RNA integrity matters more than concentration. See Technical Resources → Sample Guide.

Delivery timing: sample shipping, customs declaration and similar steps may extend turnaround; actual project timelines prevail.

Request a Quote or Study Design

Tell us about your project — we reply within one business day (free assessment)

Used only for this enquiry; never shared.

Start Your Multi-omics Project

Free study design · Interactive execution · In-depth data interpretation
Official Channels
OFFICIAL CHANNELS
WeChat Official Account QR
Official Account
WECHAT OFFICIAL ACCOUNT
WeChat QR
WeChat Service
CUSTOMER SERVICE
Xiaohongshu QR
Xiaohongshu
XIAOHONGSHU
Call us:400-660-8826
WeChat QR
Scan to chat on WeChat