Flavoromics

Flavoromics — Volatile Metabolomics on GC×GC-TOF MS

Based on comprehensive two-dimensional gas chromatography–time-of-flight mass spectrometry (GC×GC-TOF MS), detecting volatile compounds with boiling points of 50–260 °C at atmospheric pressure. Compared with conventional one-dimensional GC-MS, peak capacity rises from one or two hundred to over ten thousand, with several to dozens of times more identified compounds; combined with a high acquisition rate of 500 full spectra per second, it provides a high-resolution solution for complex samples and unknowns.

GC×GC-TOF MS
GC×GC-TOF MS Platform
COMPREHENSIVE 2D GC
500 spectra/s
Full-Spectrum Acquisition Rate
SPECTRAL ACQUISITION RATE
300+
Sample Types Experienced
SAMPLE TYPES EXPERIENCED

Technical Specifications

TECHNICAL SPECIFICATIONS
ItemDetails
PlatformComprehensive two-dimensional GC-TOF MS (GC×GC-TOF MS) for volatiles boiling at 50–260 °C at atmospheric pressure
IdentificationChromaTOF annotation with dual verification — standard spectral-library matching plus retention index (RI) calculated from C7–C30 n-alkanes — yielding Level 1 identifications
QuantificationSingle-point semi-quantification with isotope internal standards; relative content from peak-area ratios (μg/g solids, μg/mL liquids) with normalization
ROAV Odor ActivityROAV calculated from odor thresholds and relative content to identify the compounds that truly drive flavor — not merely the most abundant ones
Sensory-Flavor MappingSensory flavor notes annotated via the Flavordb database, translating "compound differences" into "flavor differences"

Analysis Content

ANALYSIS MODULES
ModuleAnalysis Content
Data Pre-analysis1D / 2D / 3D total ion chromatograms (TIC) · annotation and identification counts · intergroup Venn diagrams · relative-content analysis · odor thresholds and ROAV analysis
Basic AnalysisCompound-class annotation (hydrocarbons/aldehydes/esters/acids/ketones/alcohols/ethers/phenols/heterocycles; PubChem + ClassyFire) · HMDB classification · KEGG annotation and functional classification · PCA / PLS-DA / OPLS-DA (permutation tests, S-plots, VIP) · cluster heatmaps and sample hierarchical clustering
Differential AnalysisDifferential compound screening (P < 0.05 and VIP > 1) · Venn diagrams · heatmaps and correlation heatmaps · K-means clustering · Z-score plots · volcano plots · bar / box / violin plots
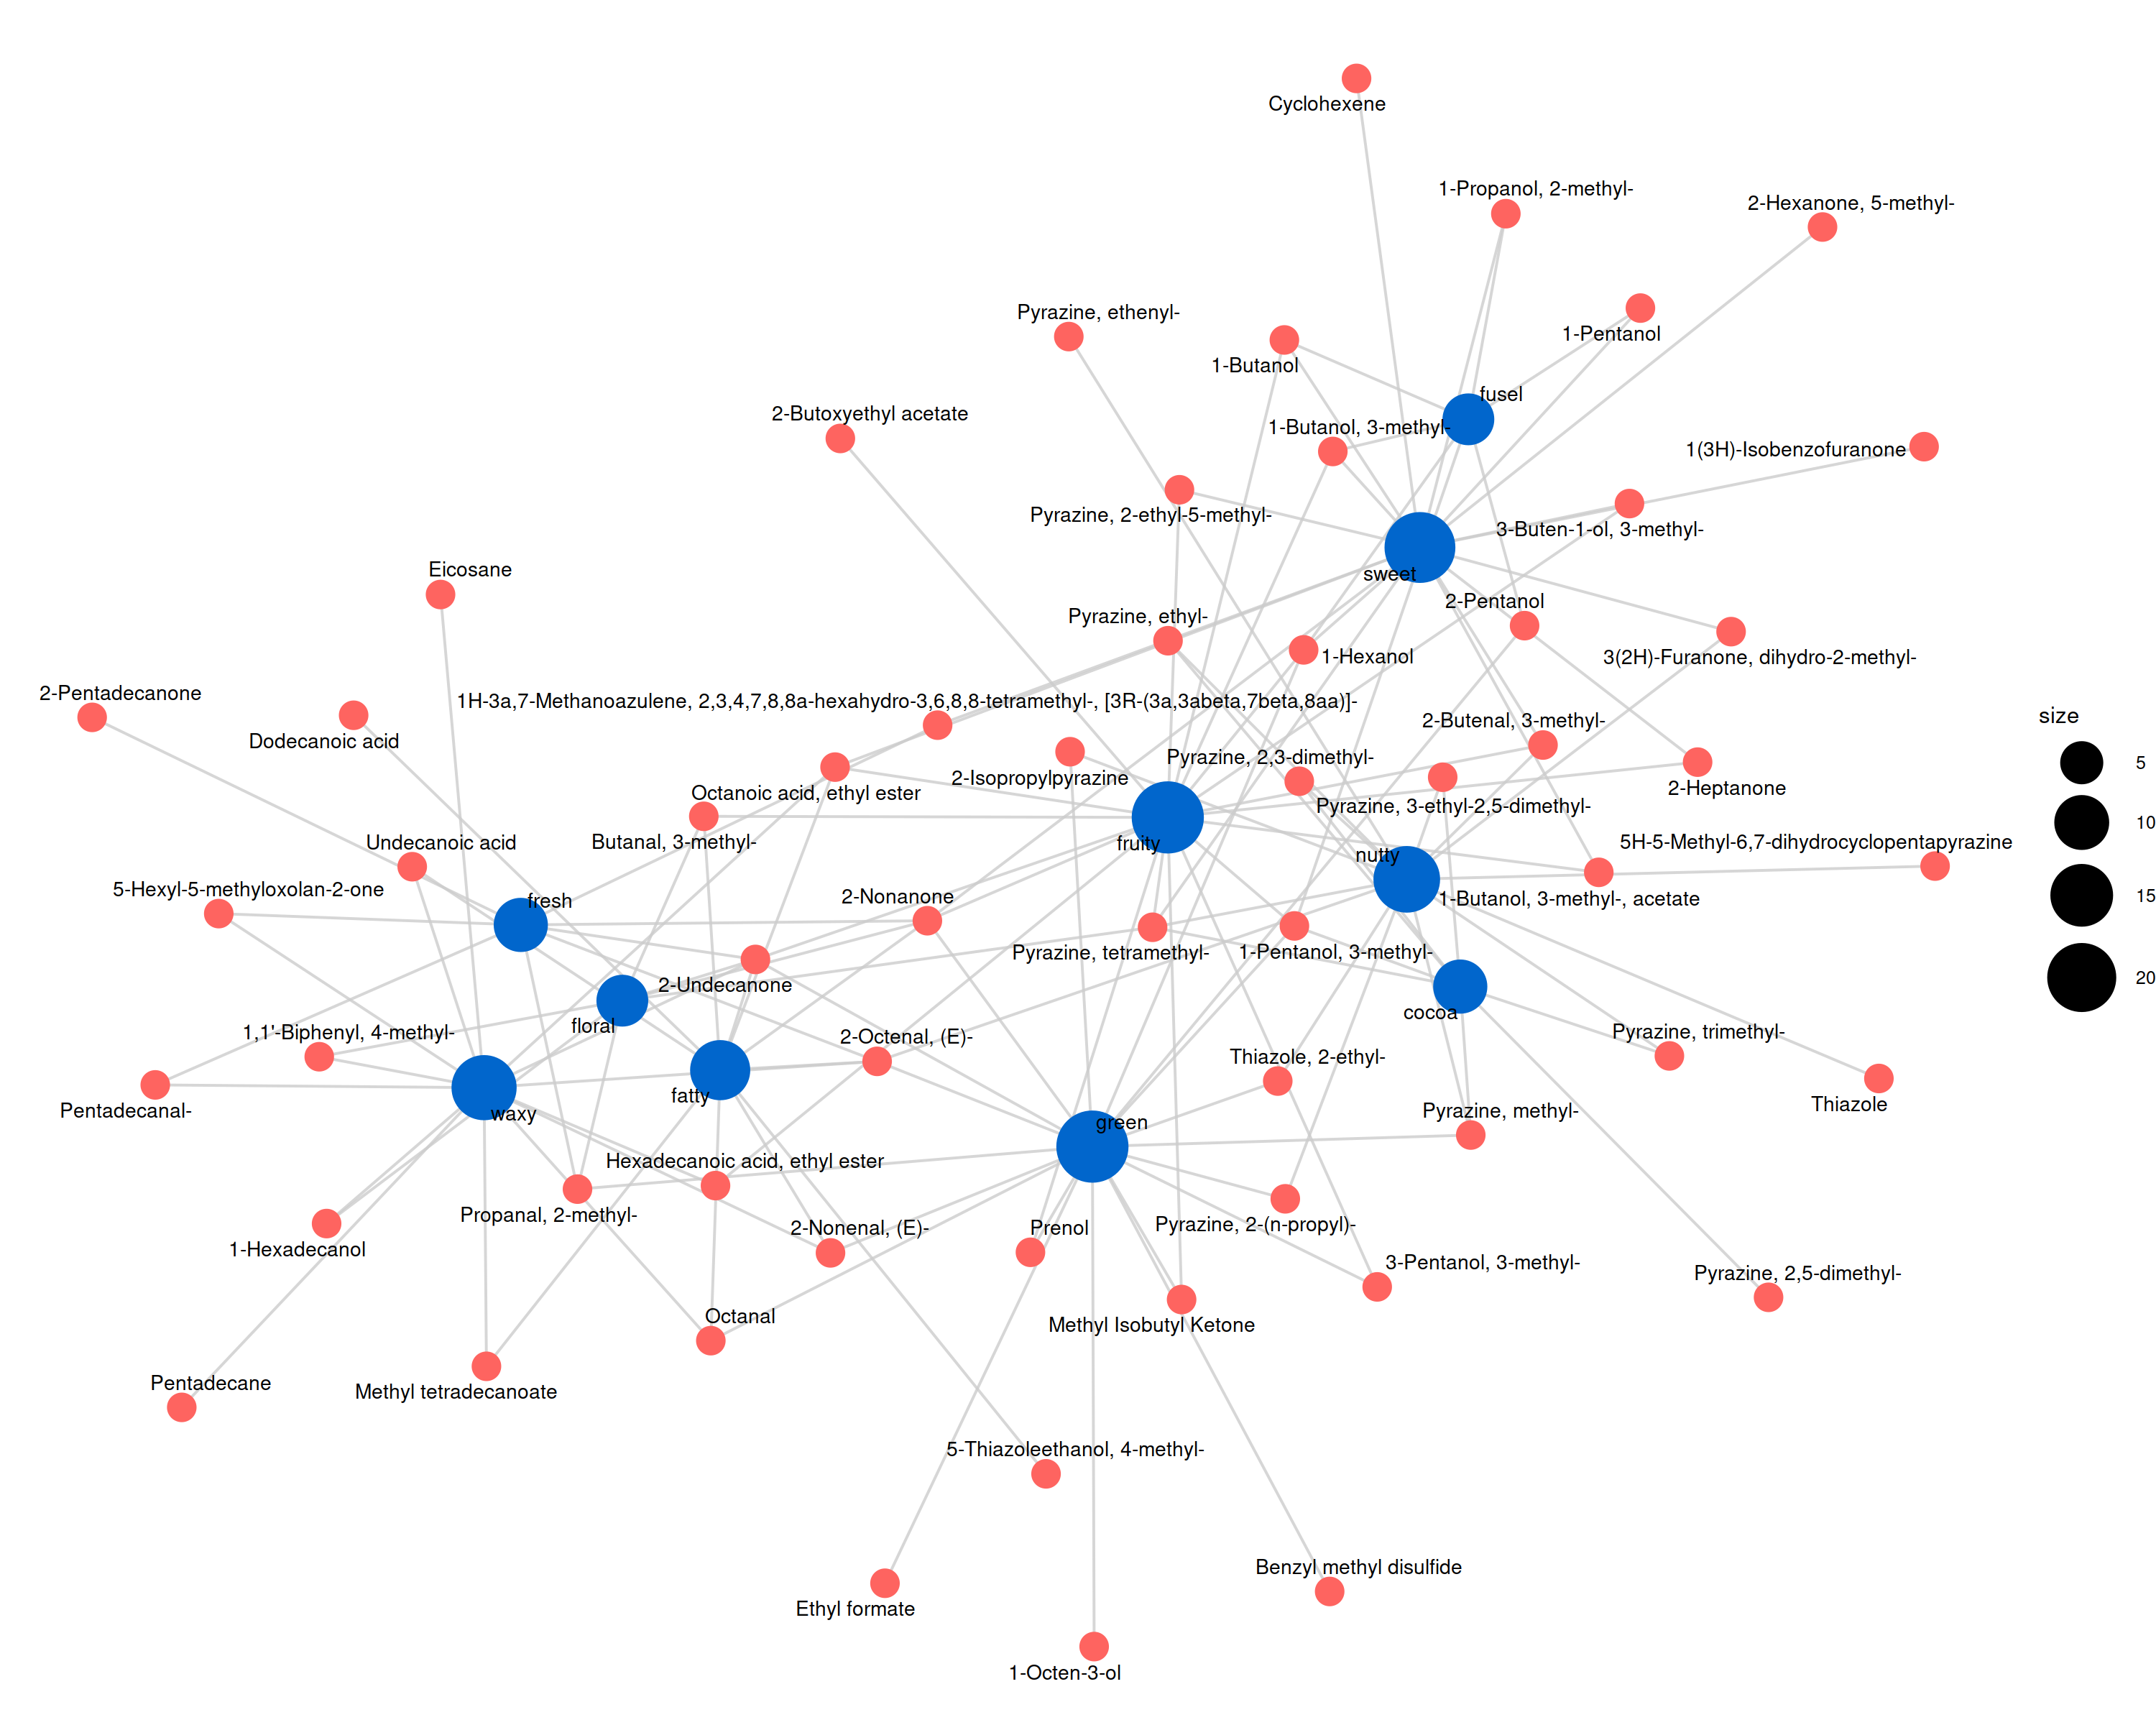
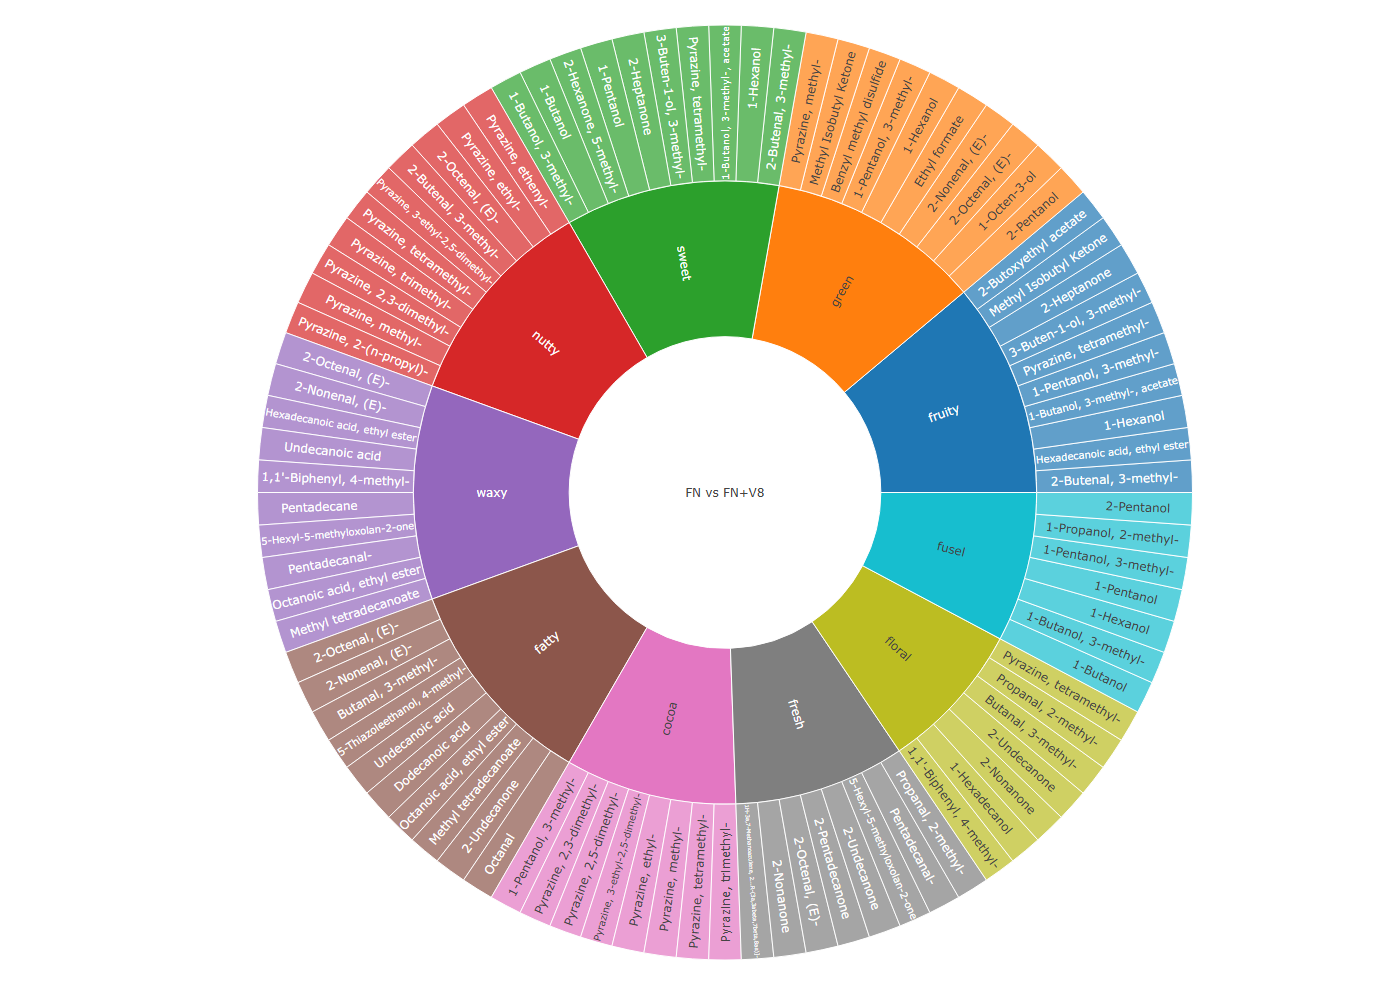
Sensory AnalysisSensory-note radar charts (frequency / content) · ROAV scatter plots of differential flavor compounds · sensory-note–compound association networks · flavor-note Sankey diagrams · flavor wheels of differential compounds
Advanced AnalysisKEGG pathway enrichment (bar / bubble plots, pathway networks, differential enrichment scores) · machine-learning biomarker screening (random-forest feature importance)

Example Results

SELECTED FIGURES FROM ACTUAL REPORTS
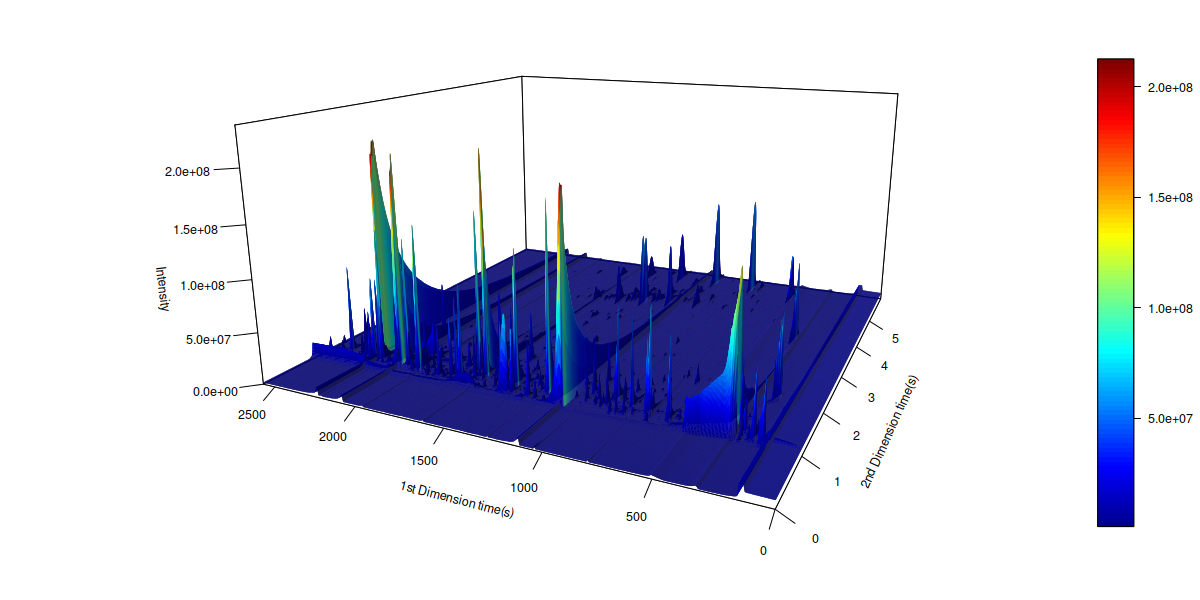
3D Total Ion Chromatogram
3D TIC panorama from GC×GC-TOF MS, visualizing the peak capacity and separation power of the comprehensive 2D platform.
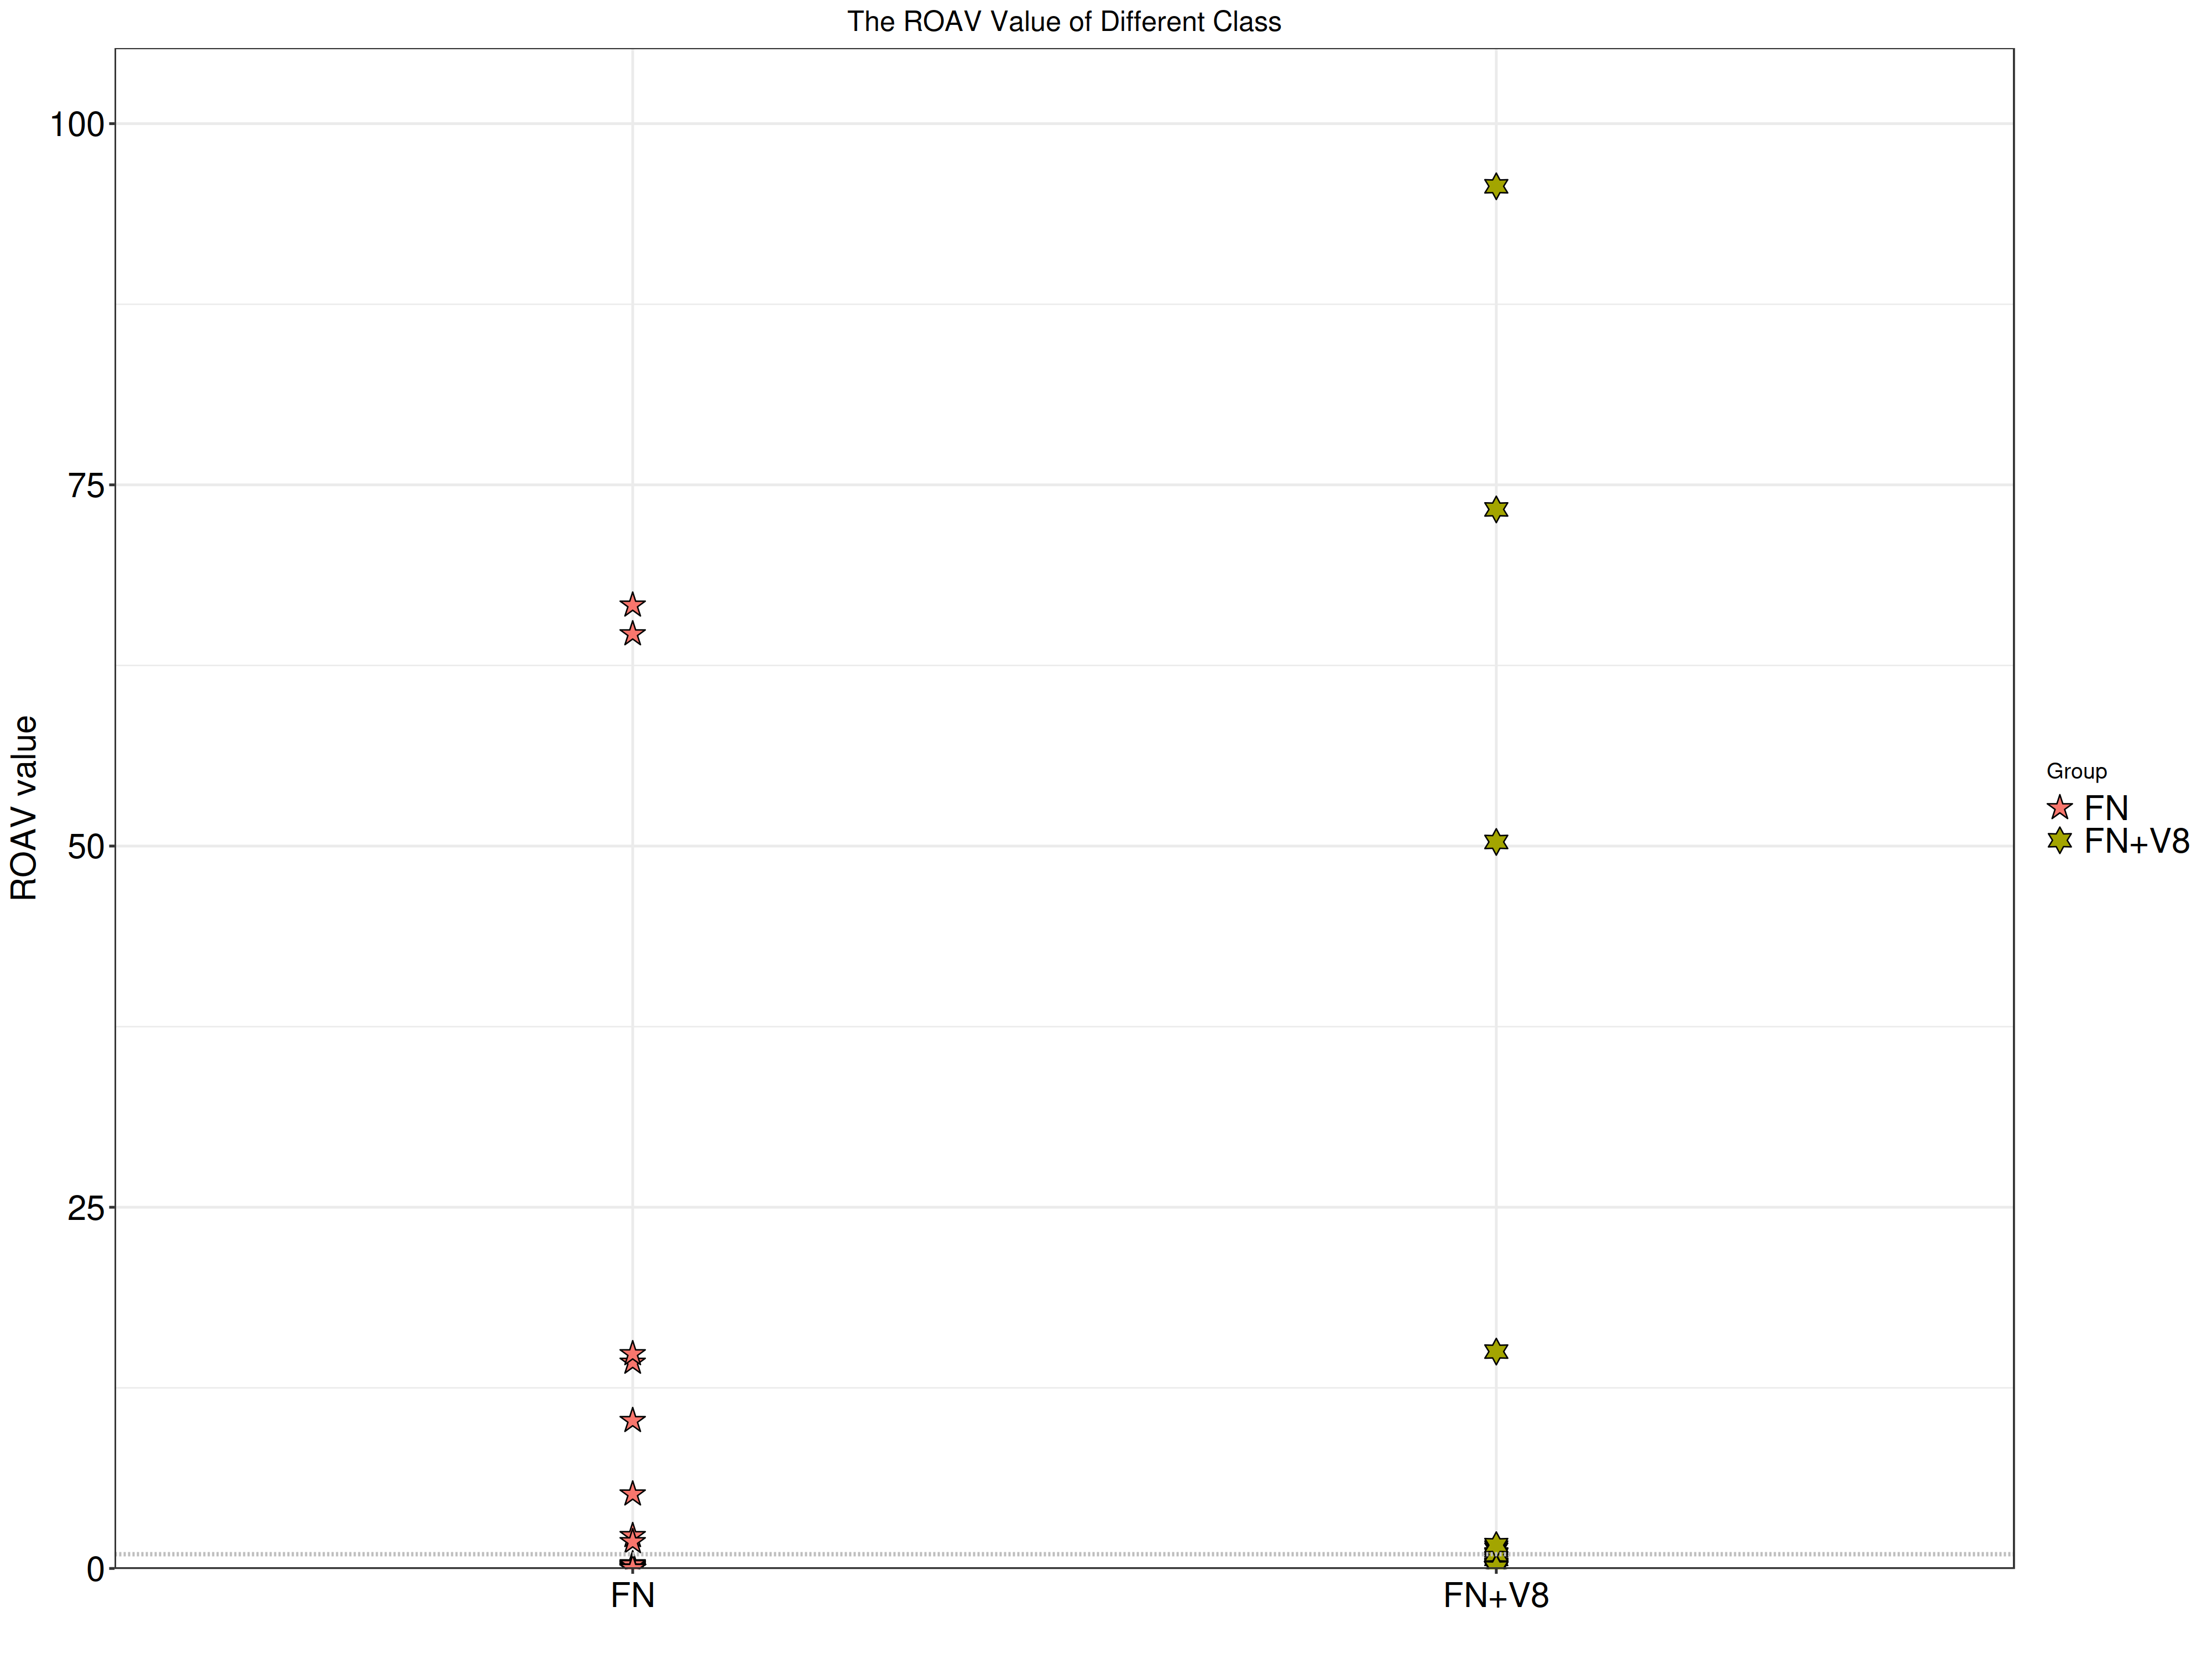
ROAV Scatter Plot
ROAV Scatter Plot
ROAV from odor thresholds and relative content, pinpointing the key volatiles that truly drive flavor.
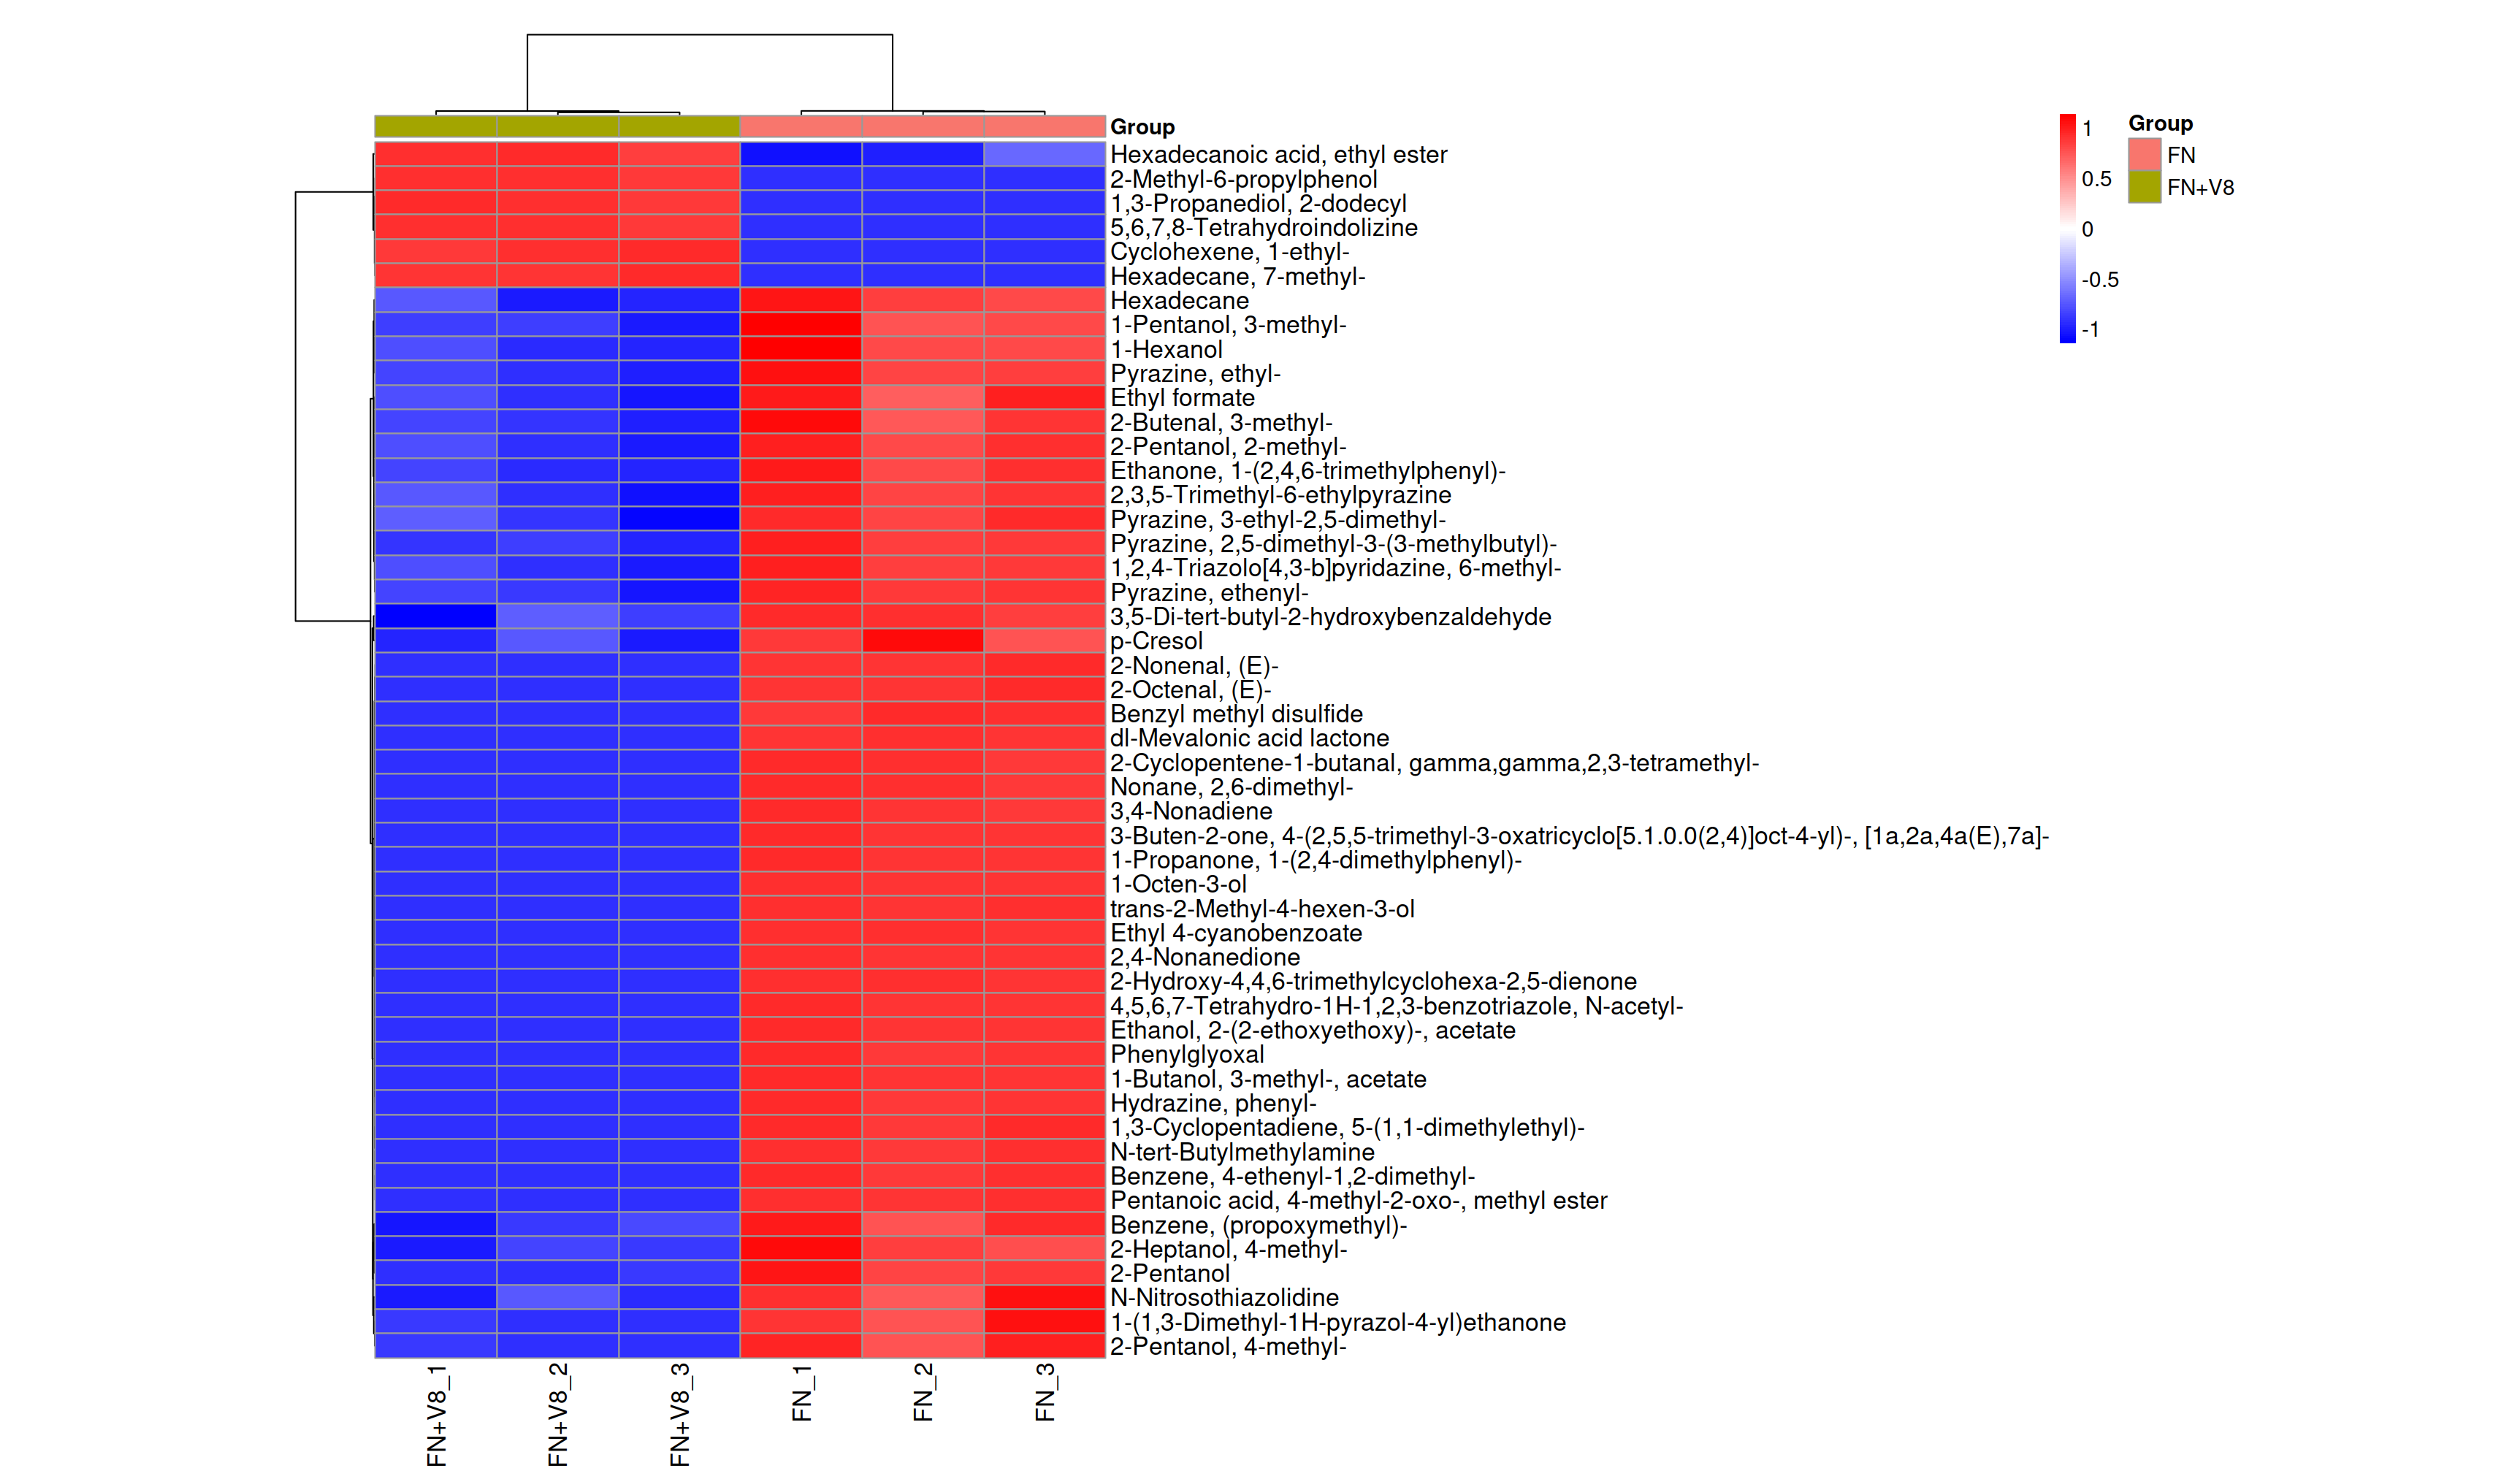
Differential Compound Cluster Heatmap
Cluster heatmap of the top-50 differential compounds, making intergroup content-pattern differences immediately visible.
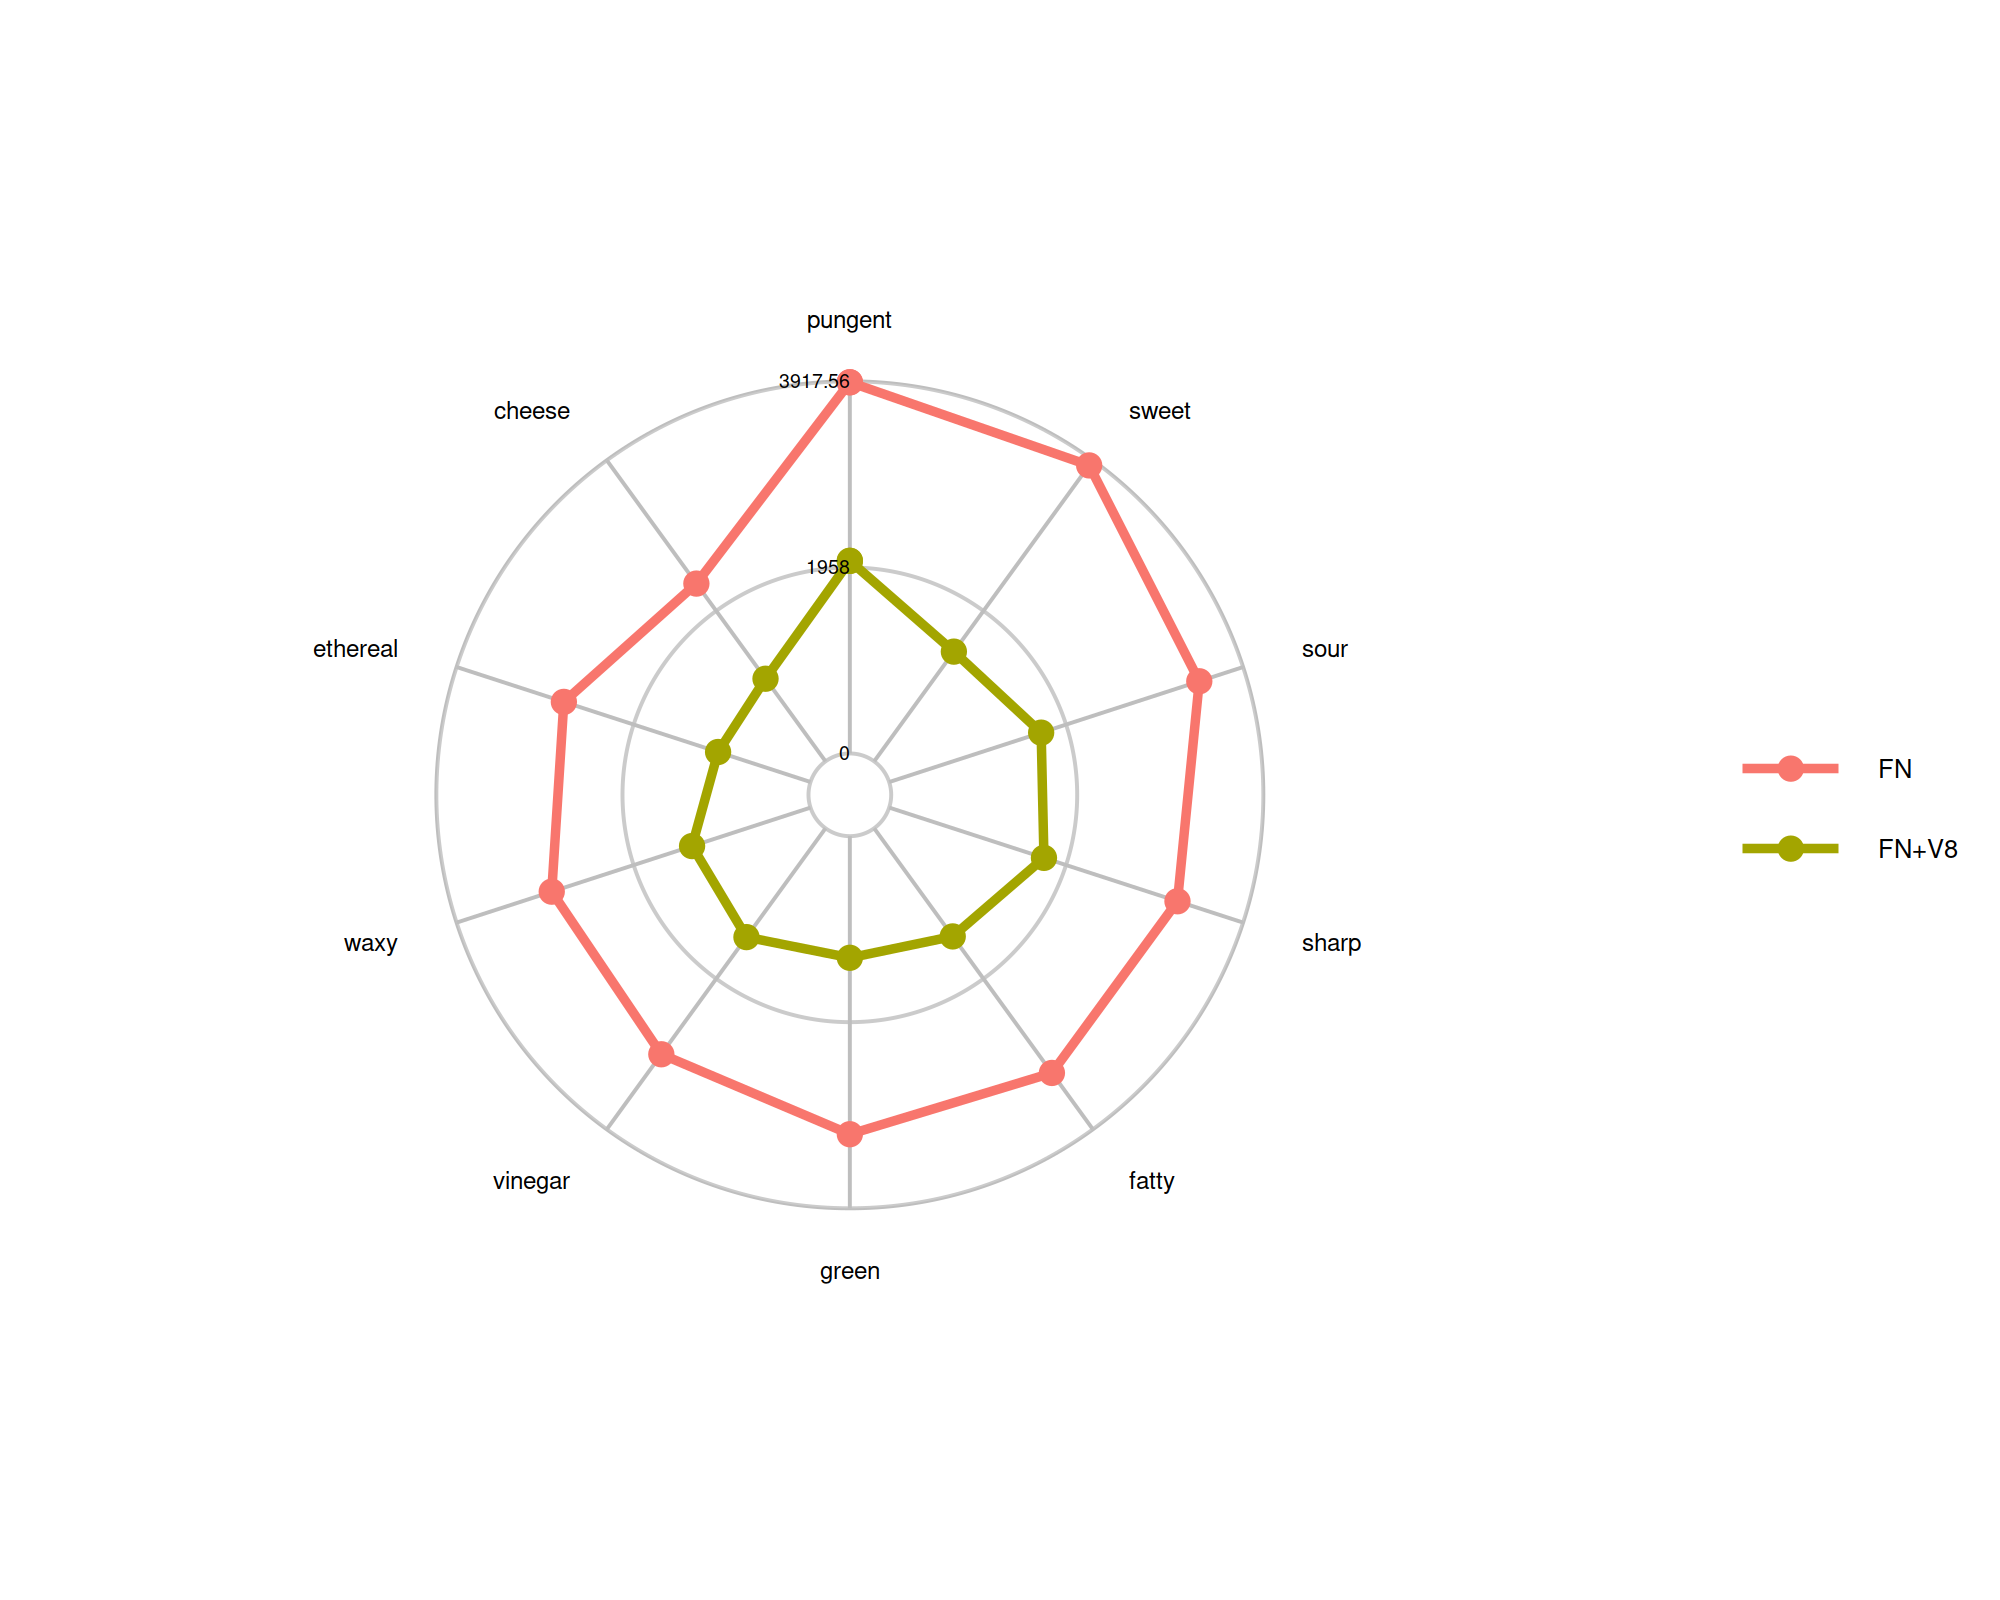
Sensory-Note Radar Chart
Radar chart of intergroup content differences for the top-10 sensory notes, directly showing flavor-profile shifts.
Sensory-Note–Compound Network
Association network of sensory notes and differential flavor compounds — translating compound differences into flavor differences.
Flavor Wheel of Differential Compounds
Flavor wheel of the top-10 sensory notes and their corresponding differential compounds; inner and outer rings map notes to compounds.
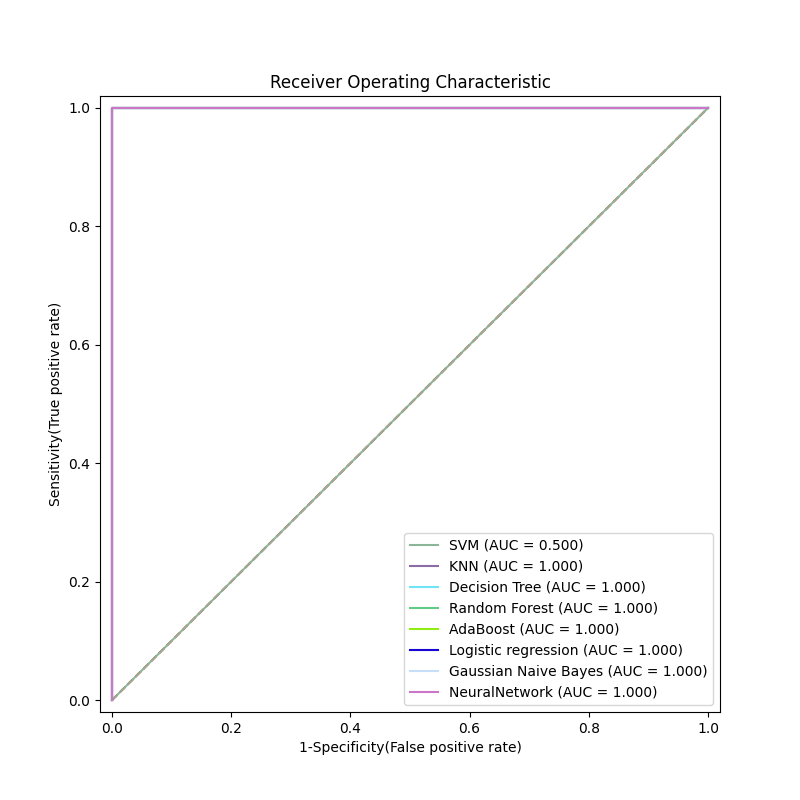
Multi-Model ROC Curves
ROC curves of multiple machine-learning models built on flavor markers, assessing marker discriminative power.

Applications

APPLICATIONS
Food Flavor Quality AnalysisProcessing Effects on FlavorOrigin & Variety AuthenticationFlavor Marker DiscoveryNew-Product R&D Support

FAQ

FAQ
How long does a Flavoromics project take?
Mature targeted panels typically take 1-3 weeks; untargeted projects take 2-4 weeks (counted from sample receipt and QC approval). The exact timeline is confirmed in writing before project start, and progress is trackable on the OmicsHub cloud platform.
What if my sample amount is below the recommendation?
Please do not dilute your samples. Low-input samples can often be accommodated by adjusting the preparation workflow — tell us the actual amount and our technical team will assess feasibility and note adjustments in the study plan.
Can I add targets to an existing panel?
Yes. Mature panels support on-demand additions; novel analytes outside the list can be implemented through custom method development (requires standards and extra validation time) — see our Custom Targeted Metabolomics service.
What samples do you need for Flavoromics?
Serum/plasma ≥100 μL (fasting, no haemolysis), tissue ≥50 mg (snap-frozen), cells ≥1×10⁶ (medium washed off), urine ≥200 μL. Keep fasting time consistent, aliquot into single-use volumes and avoid freeze–thaw. Full guidance: Technical Resources → Sample Guide.

Delivery timing: sample shipping, customs declaration and similar steps may extend turnaround; actual project timelines prevail.

Request a Quote or Study Design

Tell us about your project — we reply within one business day (free assessment)

Used only for this enquiry; never shared.

Start Your Multi-omics Project

Free study design · Interactive execution · In-depth data interpretation
Official Channels
OFFICIAL CHANNELS
WeChat Official Account QR
Official Account
WECHAT OFFICIAL ACCOUNT
WeChat QR
WeChat Service
CUSTOMER SERVICE
Xiaohongshu QR
Xiaohongshu
XIAOHONGSHU
Call us:400-660-8826
WeChat QR
Scan to chat on WeChat