Metagenomics

Shotgun Metagenomics — Species & Functional Gene Profiling

Shotgun metagenomic sequencing requires no amplification or cultivation — total DNA from environmental samples is randomly sequenced, yielding microbial species composition and functional-gene information in a single experiment. After assembly, gene prediction and non-redundant gene-set construction, taxonomic and functional annotation (GO / KEGG / COG / CAZy / CARD) is completed, followed by community composition, diversity and differential analyses.

6 G
Sequencing Data Volume
SEQUENCING DATA
5
Functional Databases
FUNCTIONAL DATABASES
8
Analysis Modules
ANALYSIS MODULES

Technical Specifications

TECHNICAL SPECIFICATIONS
ItemDetails
Sequencing Data Volume6 G / 10G
AssemblyAssembly into contigs with MEGAHIT (succinct de Bruijn graph); N50, contig counts and length distributions reported
Gene PredictionProdigal predicts prokaryotic and metagenomic ORFs, outputting gene sequences, protein sequences and GFF files
Non-redundant Gene SetMMseqs2 clustering at 95% identity and 90% alignment coverage for dereplication; gene abundance quantified by Bowtie2 mapping
Taxonomic & Functional AnnotationTaxonomic annotation by DIAMOND against NCBI-NR; functional annotation across five databases — GO, KEGG, COG, CAZy and CARD (including antibiotic resistance ontology ARO)

Analysis Workflow

ANALYSIS WORKFLOW
1
Data QC
Raw · cleaned data
2
Assembly
MEGAHIT · contigs
3
Gene Prediction
Prodigal · ORF
4
Gene-set construction
MMseqs2 · Bowtie2
5
Functional annotation
NR / KEGG / CAZy
6
Composition analysis
Venn · Bar · heatmap
7
Diversity analysis
Alpha · Beta
8
Differential Analysis
LEfSe · rank-sum tests

Bioinformatics Analyses

BIOINFORMATIC MODULES
ModuleCore Methods & MetricsKey Outputs
Sequencing StatisticsRaw fastq (R1/R2) statistics: data volume, read counts, base counts, Q20/Q30 and GC content; base retention rate after adapter trimming and quality filteringRaw and cleaned data statistics tables, base-quality and content distribution plots
AssemblyMEGAHIT (succinct de Bruijn graph) assembles effective sequences per sample into contigs; N50, contig counts and length distributions reportedAssembly statistics tables, length distribution plots
Gene PredictionProdigal predicts prokaryotic and metagenomic ORFs and coding regions, outputting gene sequences, protein sequences and GFF filesGene sequence files, protein sequence files, GFF
Non-redundant Gene SetMMseqs2 clustering at 95% identity and 90% alignment coverage for dereplication; per-sample effective reads mapped to the gene set with Bowtie2 for abundanceNon-redundant gene set, gene abundance tables
Taxonomic & Functional AnnotationDIAMOND against NCBI-NR for taxonomic annotation with abundance computed from domain to species; functional annotation across GO, KEGG, COG, CAZy and CARD (including ARO)Annotation summary tables, per-database level abundance tables
Composition analysisVenn diagrams, community bar plots and abundance heatmaps at species (Species/Genus/Family, etc.) and function (KO/COG/CAZy/ARO/GO/Pathway) levelsVenn diagram, community bar plots, heatmap
Diversity analysisAlpha-diversity indices with intergroup boxplots; beta-diversity distance matrices, hierarchical clustering, PCA / PCoA / NMDS ordination and ANOSIM testsIndex boxplots, PCA / PCoA / NMDS plots, ANOSIM plots
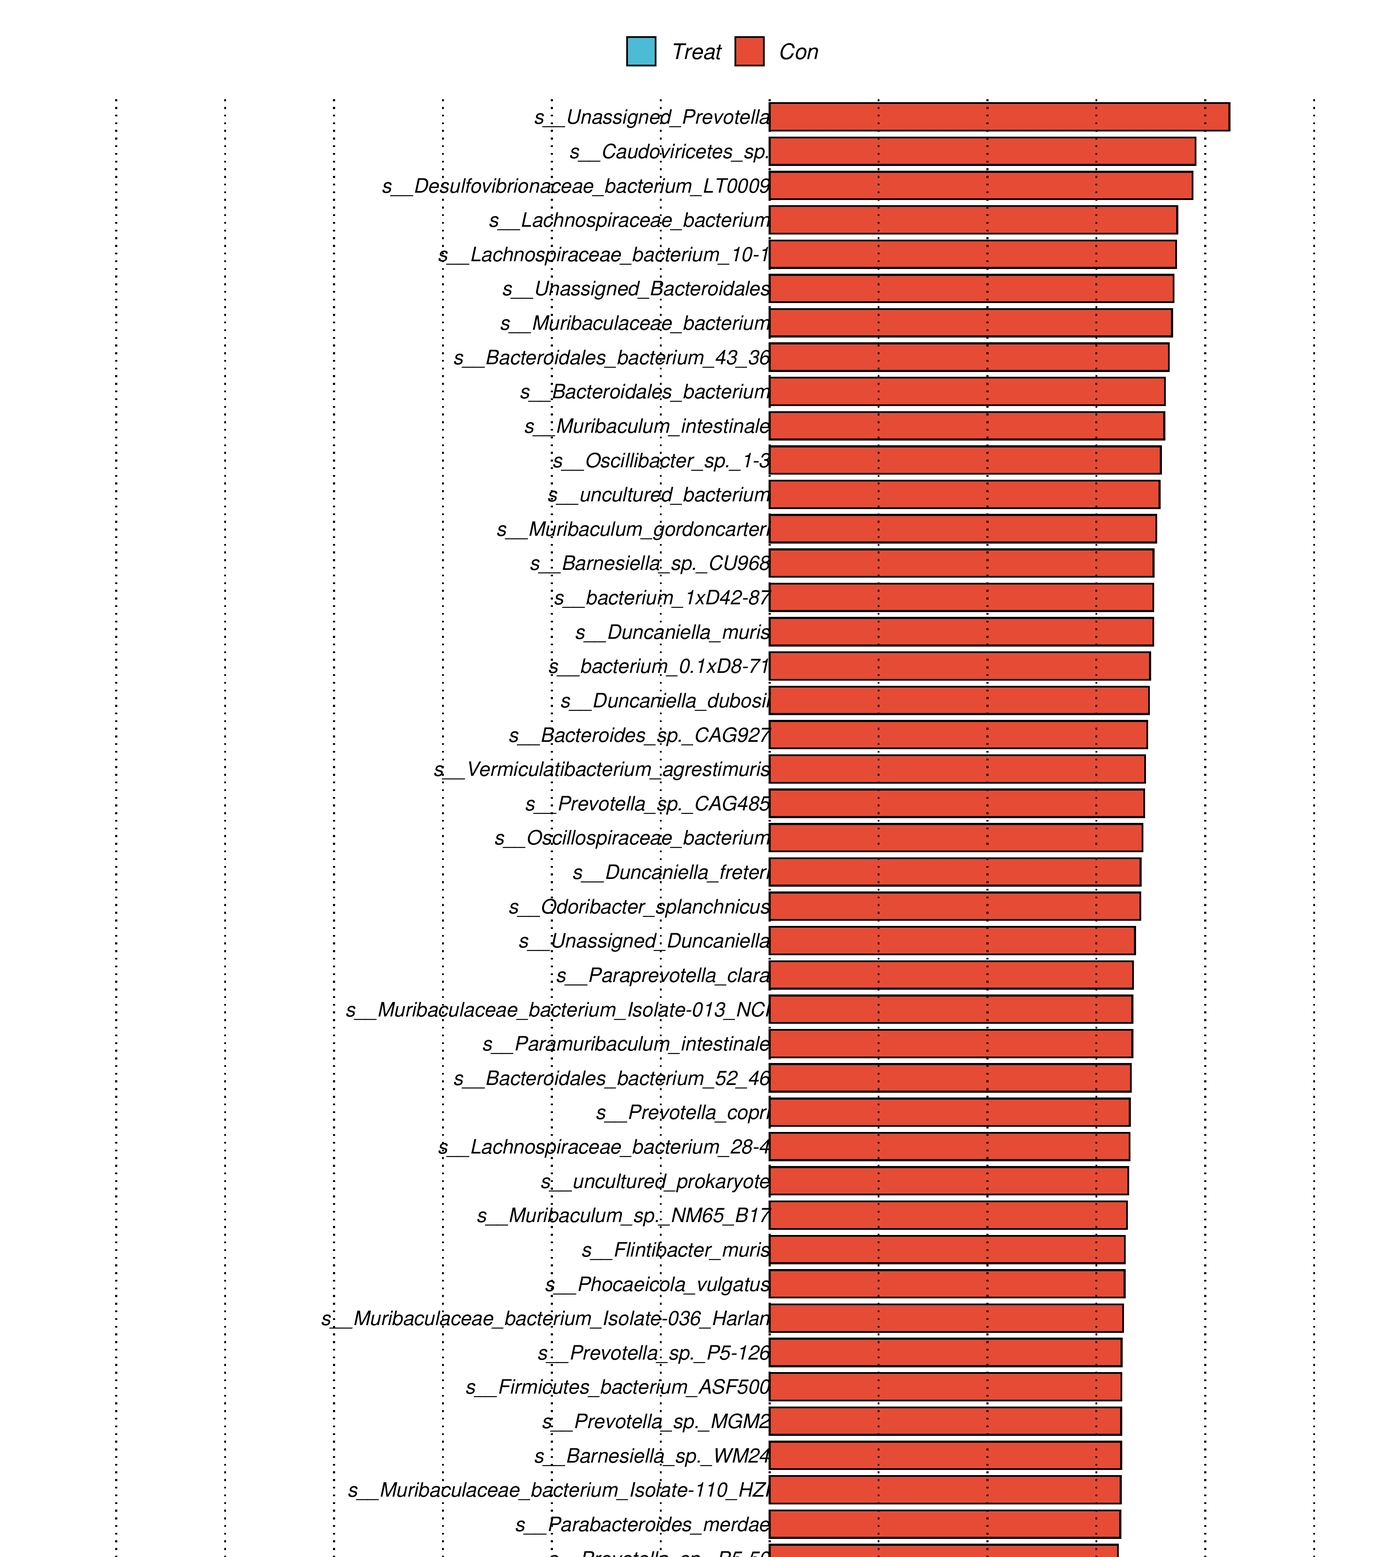
Differential AnalysisLEfSe (LDA) at species and functional levels; intergroup Wilcoxon rank-sum tests to screen differential taxa and functional unitsLEfSe plots, LDA bar charts, differential test tables

Example Results

SELECTED FIGURES FROM ACTUAL REPORTS
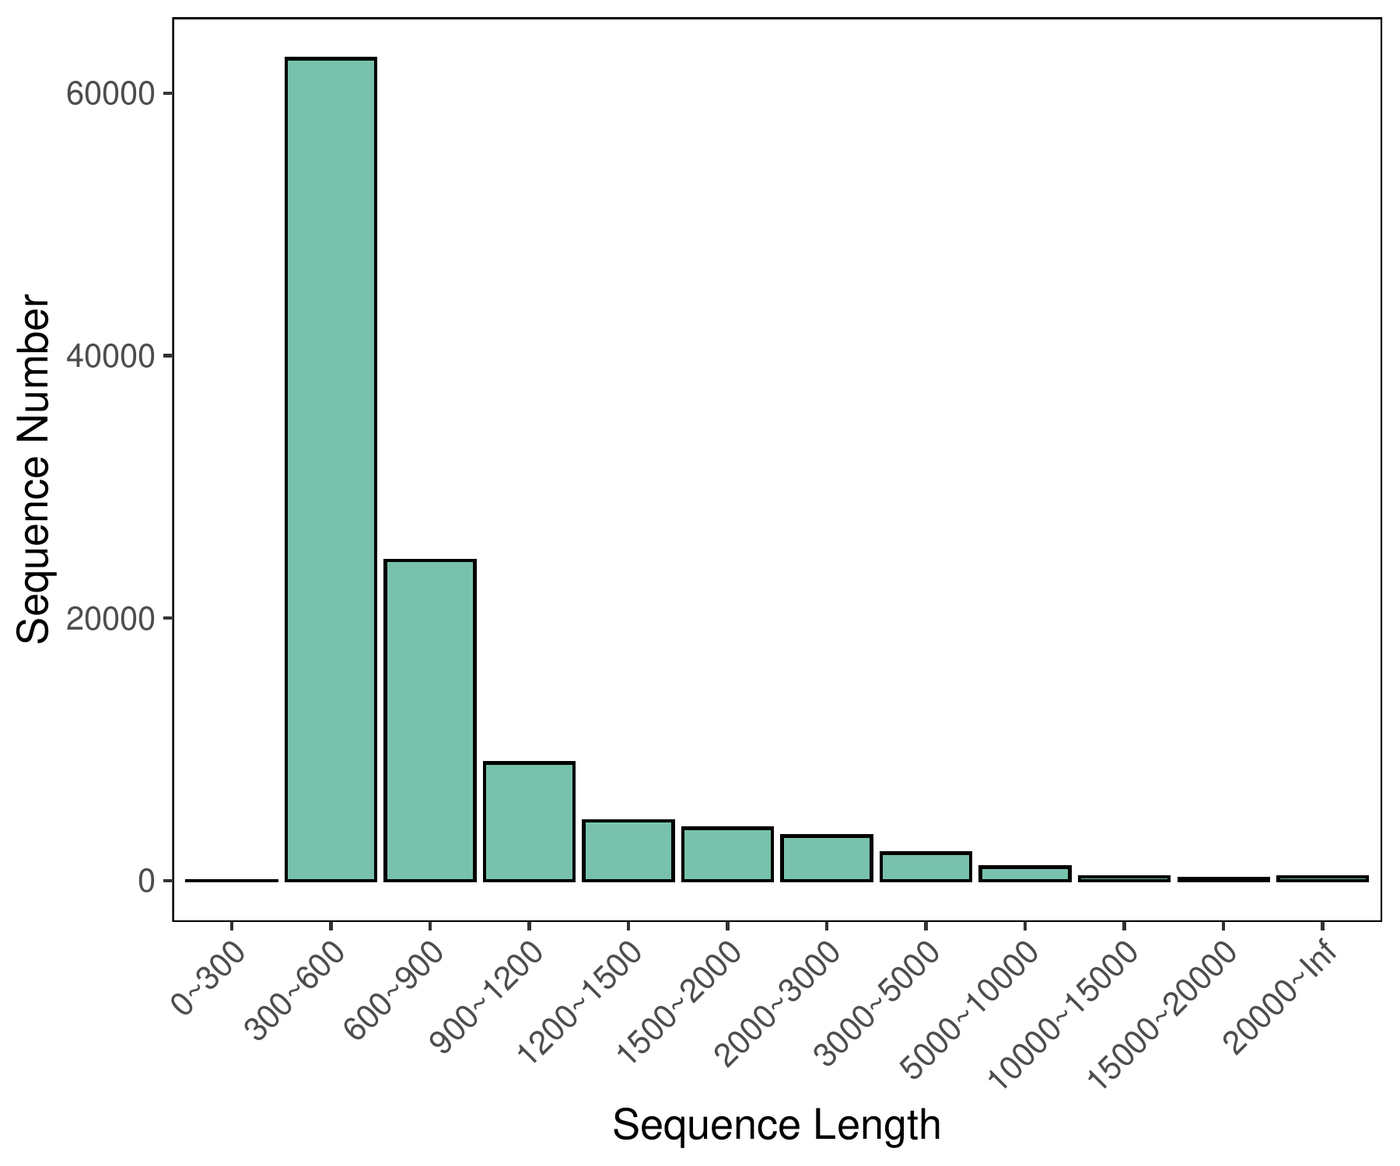
Contig Length Distribution
Length-interval distribution of assembled contigs per sample, with N50 and other assembly metrics.
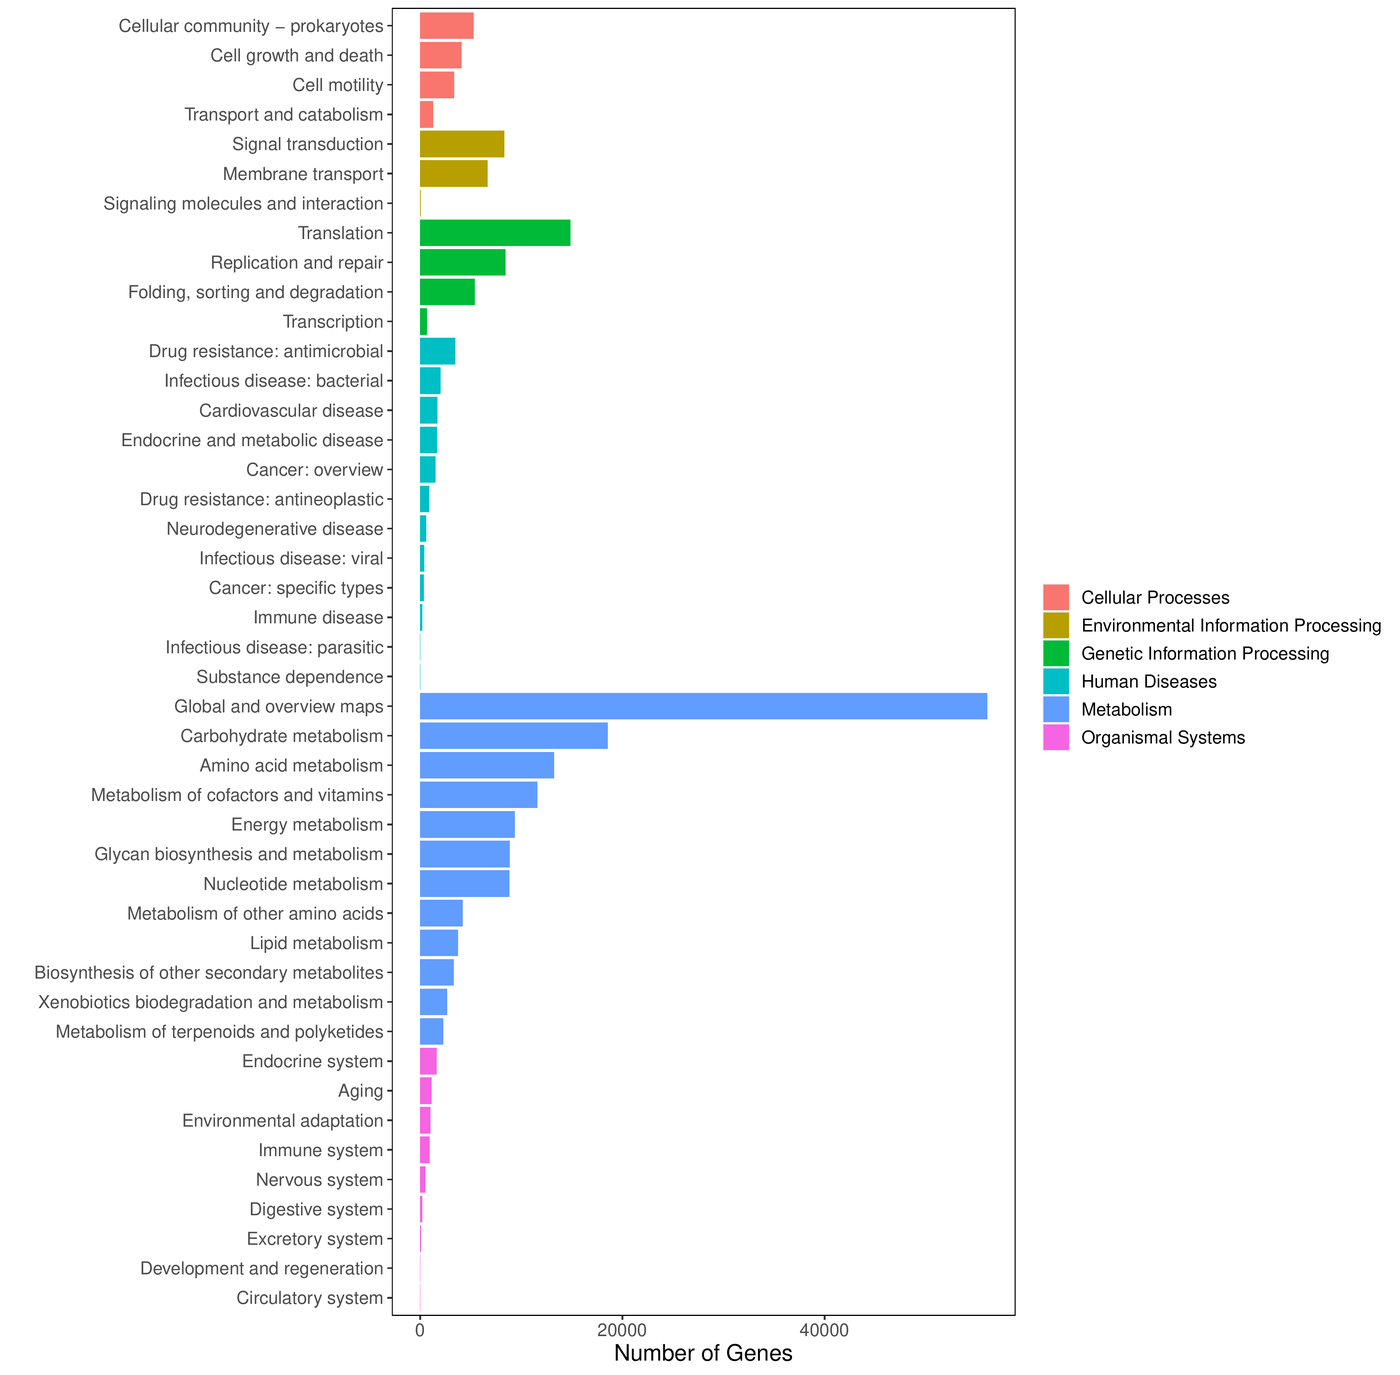
KEGG Functional Annotation
Gene counts at KEGG level-2 pathways, colored by major categories such as metabolism and genetic information processing.
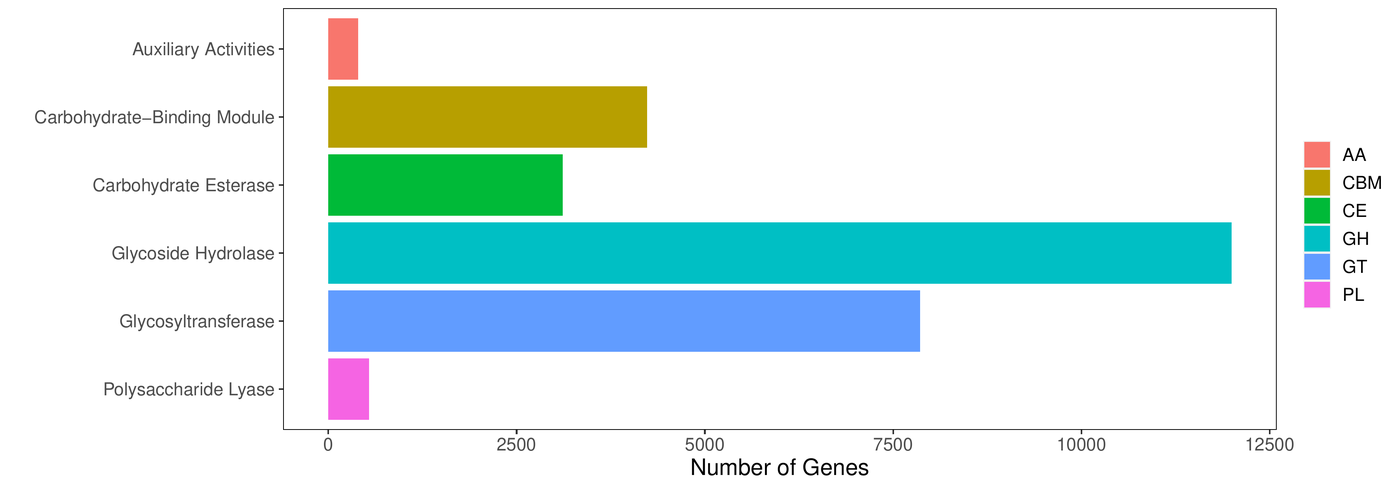
CAZy Annotation
CAZy Annotation
Gene counts across the six functional modules (GH / GT / PL / CE / AA / CBM).
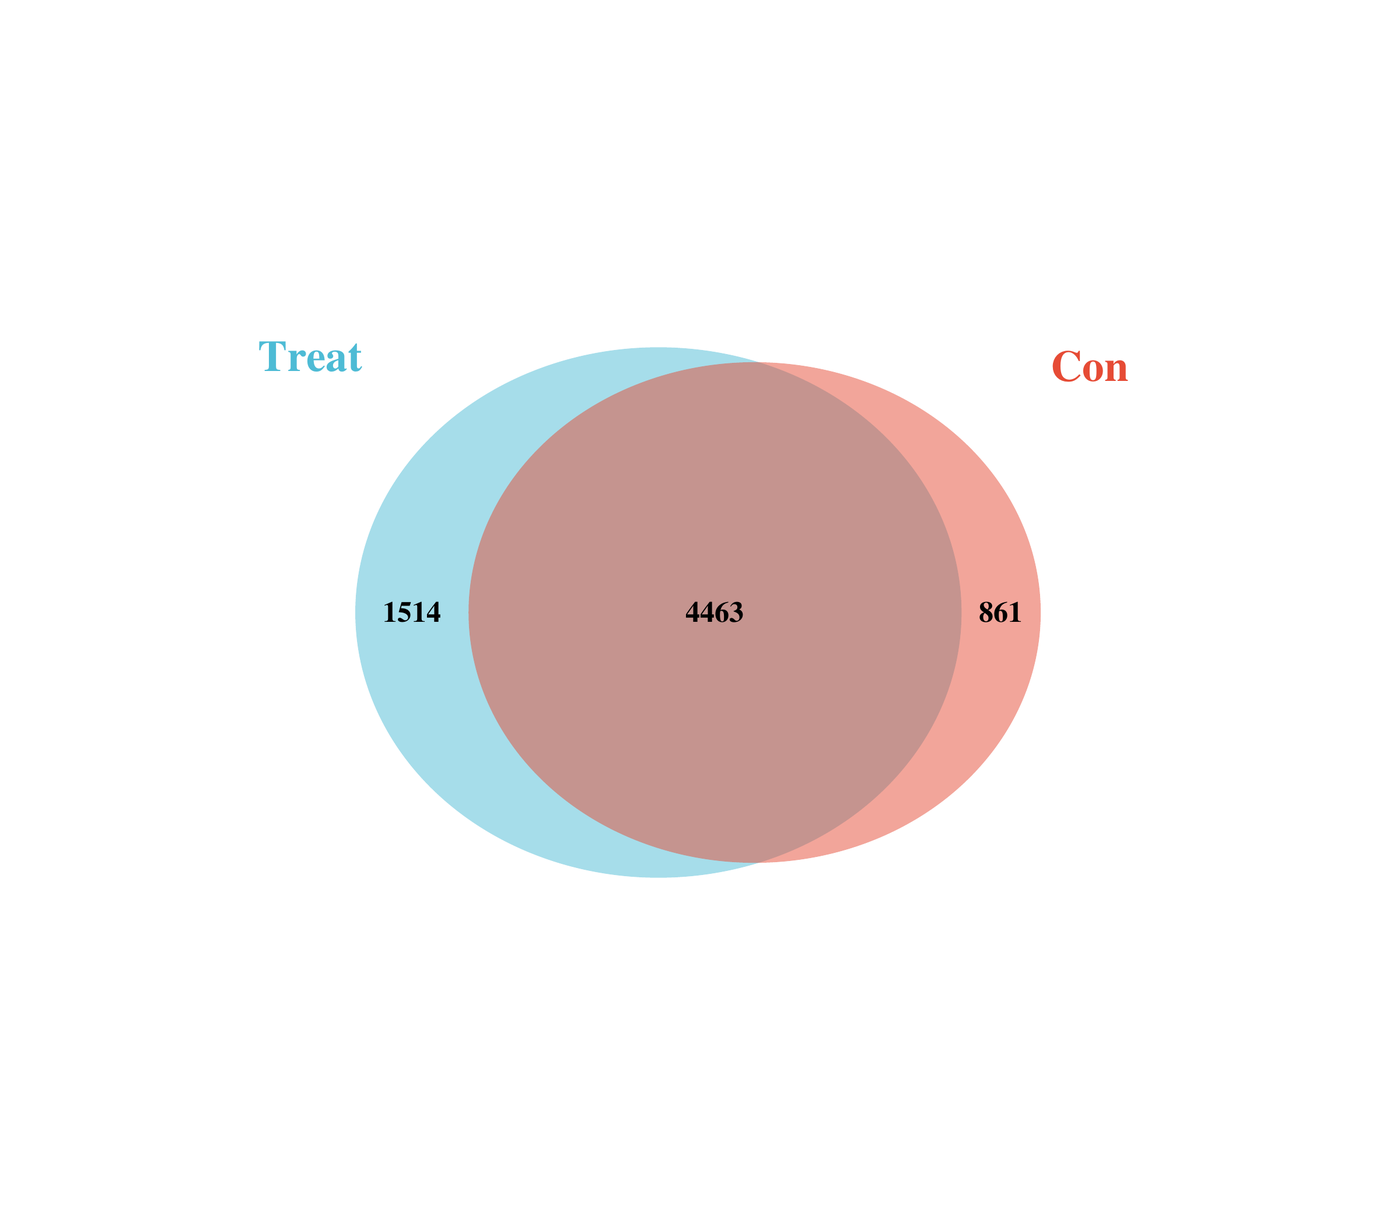
Shared / Unique Species Venn Diagram
Shared and unique species between Treat and Con groups.
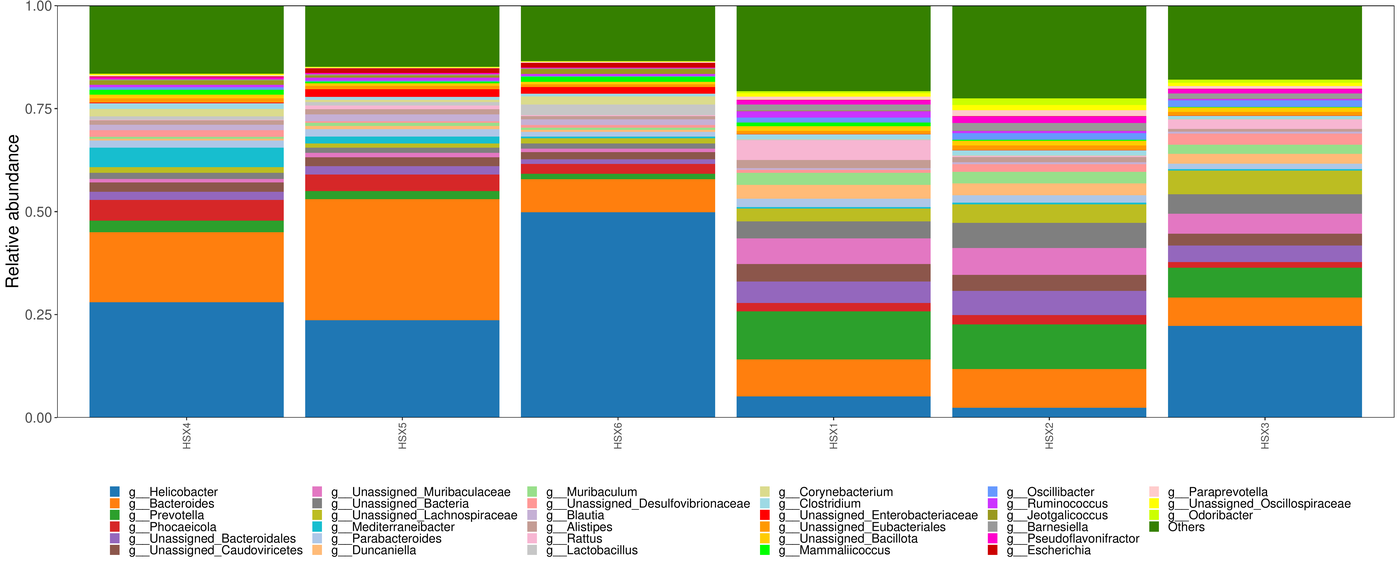
Species Composition Bar Plot (Genus)
Genus-level relative abundance per sample, visualizing intergroup community-structure differences.
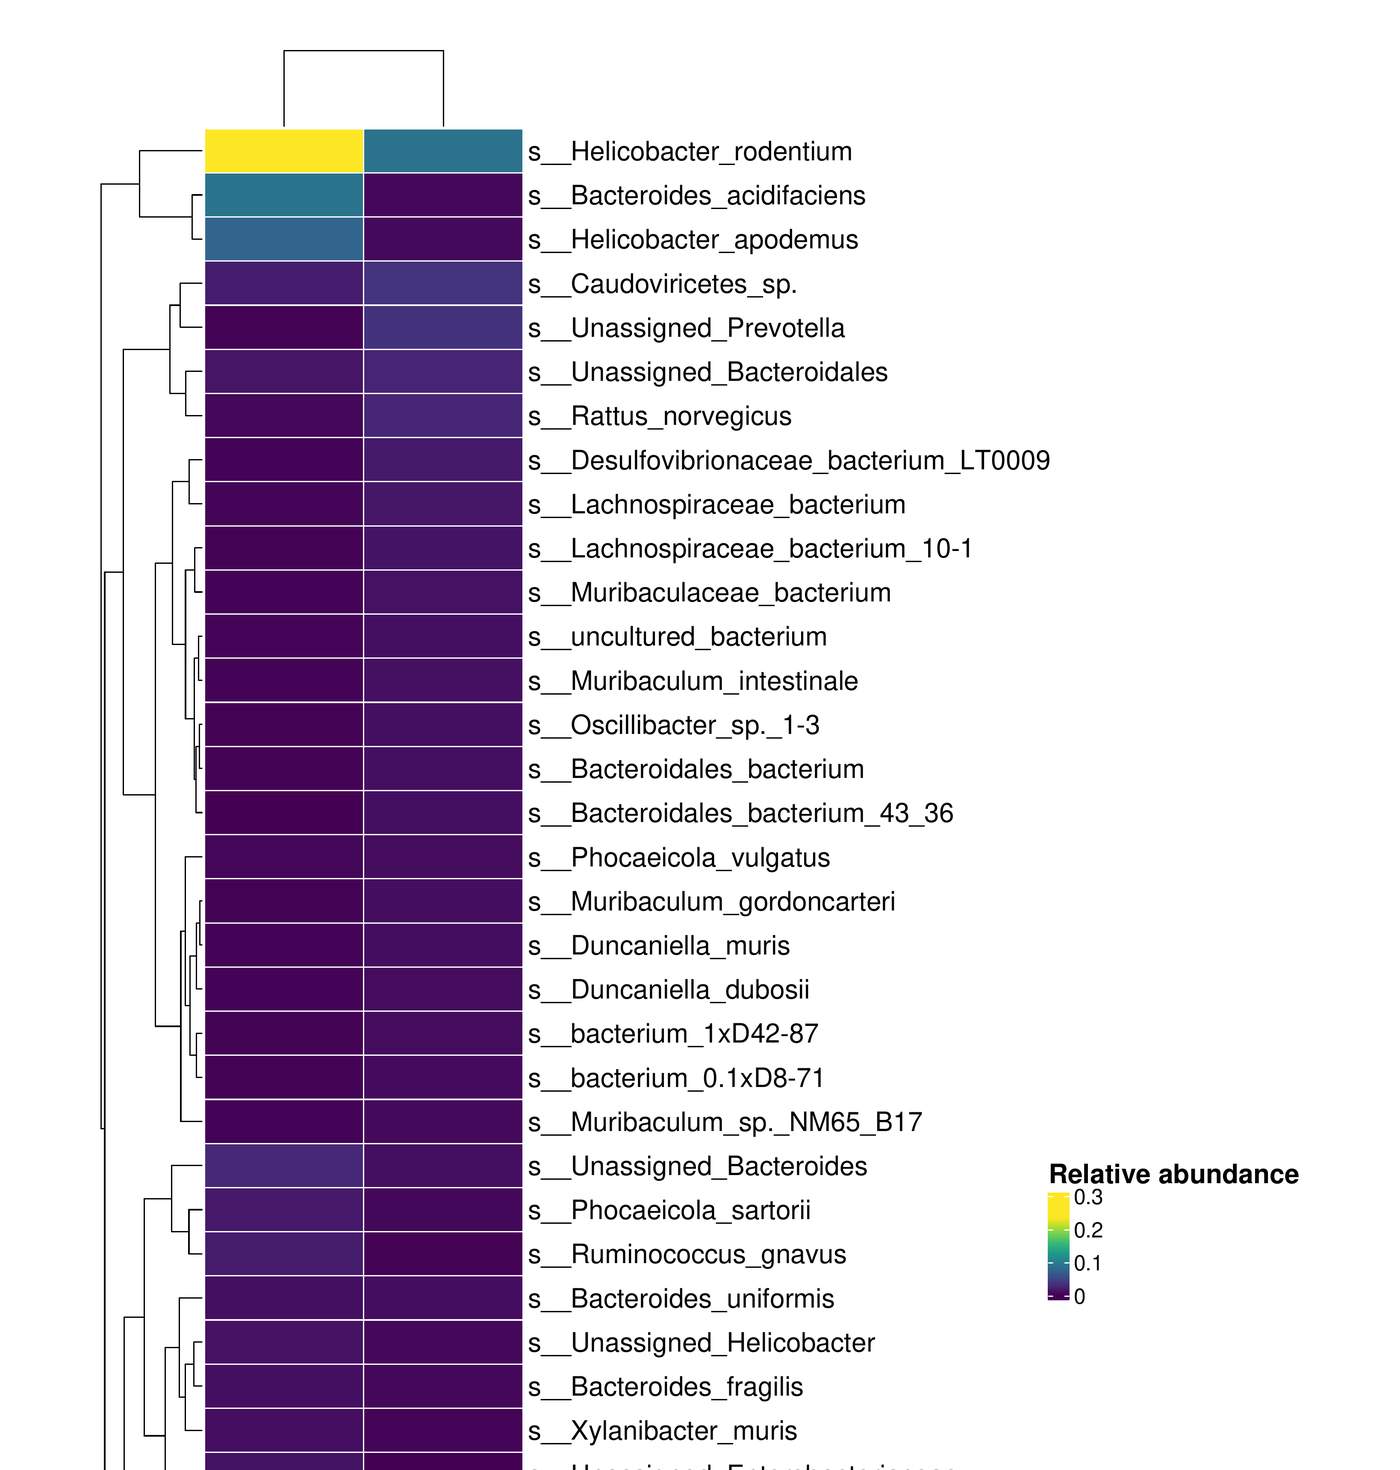
Species Abundance Heatmap (Excerpt)
Abundance distribution and hierarchical clustering of top species across samples; selected species shown.
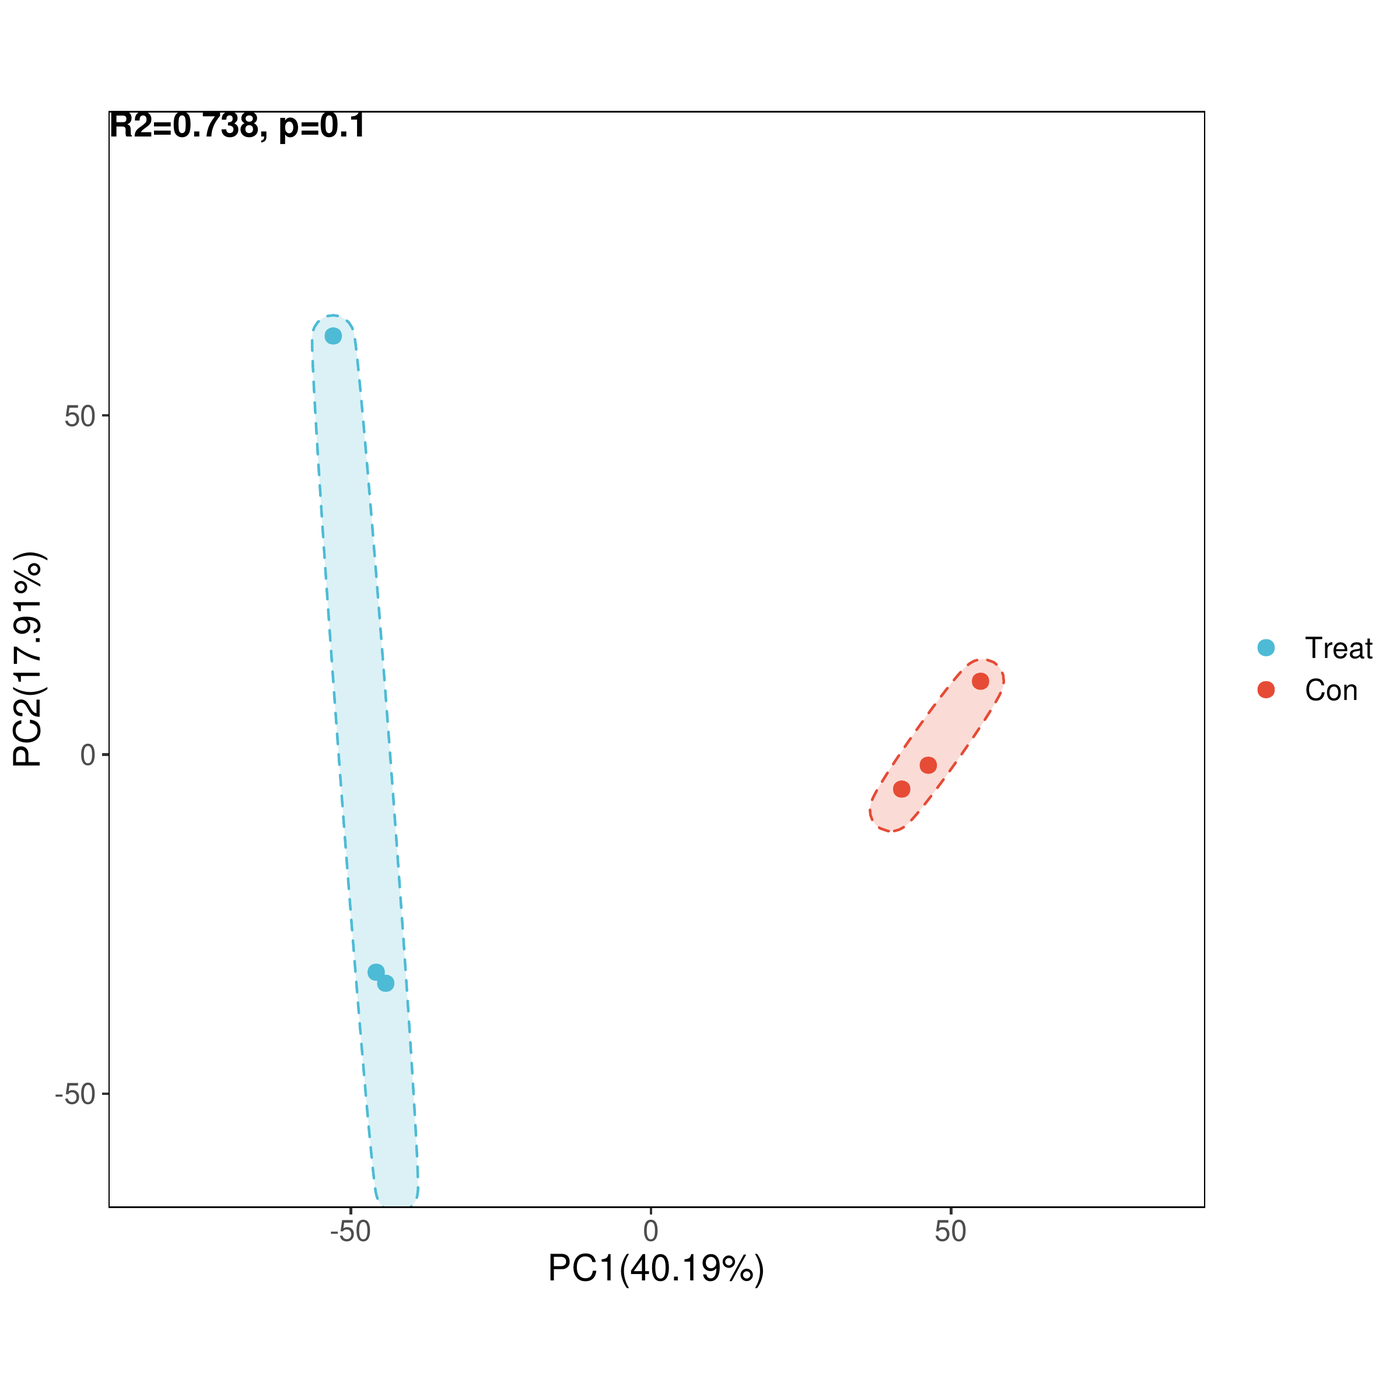
PCA (Species)
PCA (Species)
Principal-component score plot showing inter-sample compositional differences and within-group clustering.
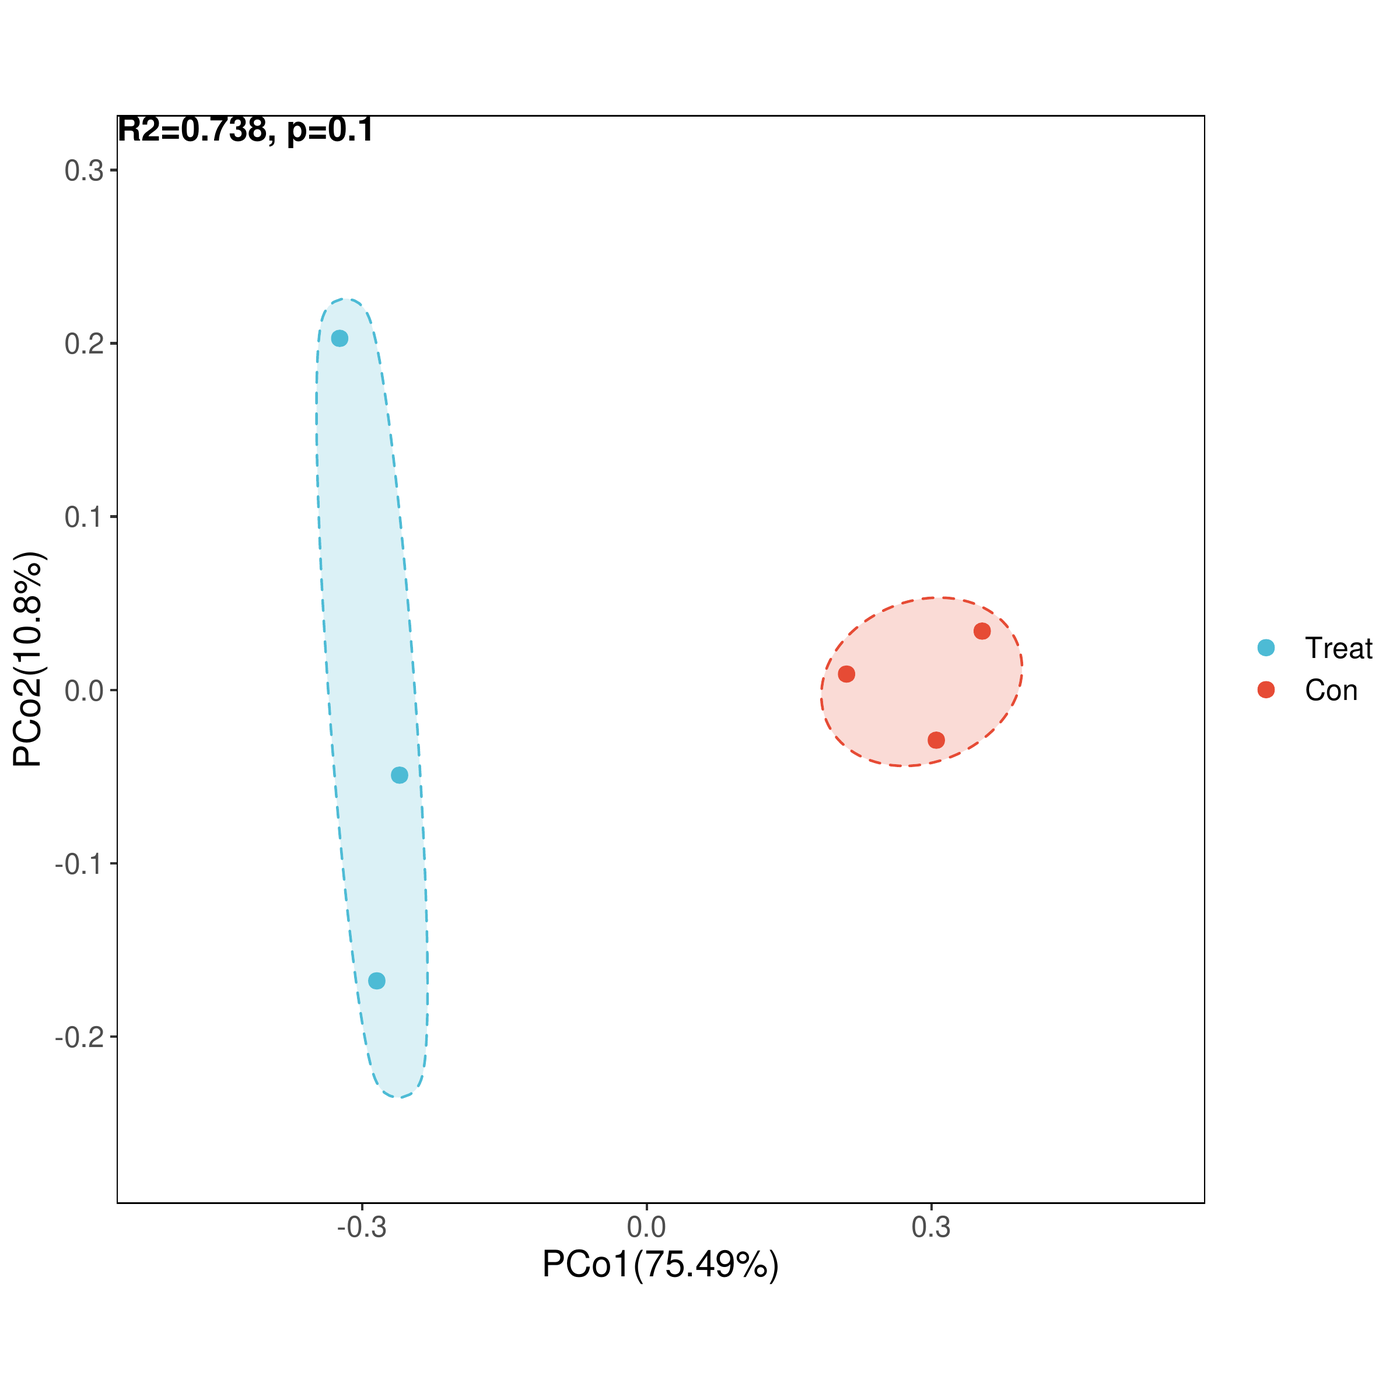
PCoA (Species, Bray-Curtis)
Principal coordinates analysis on species distance matrices; confidence ellipses show group structure.
LEfSe LDA Bar Chart (Excerpt)
Significantly different species between groups with LDA scores; colors distinguish groups; top items shown.

Applications

APPLICATIONS
Microbiome Functional PotentialNovel Gene & Pathway DiscoveryResistance Genes & Environmental MonitoringHost–Microbe InteractionsMetagenome-Assembled Genomes

FAQ

FAQ
How long does a Metagenomics project take?
From sample QC approval, standard timelines are 3-6 weeks (library prep, sequencing and bioinformatics included); large cohorts or deep custom analyses follow the confirmed study plan.
What if my samples fail QC?
Failed QC is reported immediately with reasons, and we discuss resampling or plan adjustments with you — sequencing never proceeds without qualification.
What bioinformatics is included? Can I add custom analyses?
Standard delivery covers QC, mapping/assembly, quantification, differential and functional enrichment analyses. Custom deep-dive and multi-omics integrative analyses are supported on request.
What samples do you need for Metagenomics?
Total RNA ≥1 μg with RIN ≥7 (snap-frozen, dry ice); microbial and faecal samples ≥200 mg (sterile, −80 °C); whole blood for WGS ≥500 μL (EDTA only, never heparin). RNA integrity matters more than concentration. See Technical Resources → Sample Guide.

Delivery timing: sample shipping, customs declaration and similar steps may extend turnaround; actual project timelines prevail.

Request a Quote or Study Design

Tell us about your project — we reply within one business day (free assessment)

Used only for this enquiry; never shared.

Start Your Multi-omics Project

Free study design · Interactive execution · In-depth data interpretation
Official Channels
OFFICIAL CHANNELS
WeChat Official Account QR
Official Account
WECHAT OFFICIAL ACCOUNT
WeChat QR
WeChat Service
CUSTOMER SERVICE
Xiaohongshu QR
Xiaohongshu
XIAOHONGSHU
Call us:400-660-8826
WeChat QR
Scan to chat on WeChat