REDOX METABOLISM

Redox Metabolites Panel

Redox Metabolism Profiling — Absolute Quantification

Redox pairs such as NAD⁺/NADH, NADP⁺/NADPH and GSH/GSSG determine cellular energy status and antioxidant capacity; their ratios directly affect glycolysis, the pentose-phosphate pathway, lipid synthesis and detoxification—core readouts for oxidative-stress and mitochondrial-function research. This service absolutely quantifies 15+ redox-related metabolites for oxidative-stress, aging, ischemia-reperfusion-injury and drug-toxicity research.

15+
redox-related molecules
TARGET COMPOUNDS
3
pairs: NAD / NADP / GSH
REDOX PAIRS
MRM
Isotope-IS Absolute Quantification
ABSOLUTE QUANTIFICATION

Targeted List & Analysis Examples

Targeted List & Analysis Examples
Targeted List (partial)
NO.Chinese NameEnglish NameCAS No.
1烟酰胺腺嘌呤二核苷酸NAD53-84-9
2还原型烟酰胺腺嘌呤二核苷酸NADH58-68-4
3烟酰胺腺嘌呤二核苷磷酸NADP53-59-8
4还原型烟酰胺腺嘌呤二核苷酸磷酸NADPH53-57-6
5半胱氨酸Cysteine52-90-4
6谷氨酸Glutamicacid56-86-0
7谷胱甘肽GSH70-18-8
8氧化谷胱甘肽GSSG27025-41-8
Full list available on request — contact our team.

Technical Specifications

TECHNICAL SPECIFICATIONS
PlatformUHPLC coupled with triple-quadrupole MS (UHPLC-MS/MS)
Ion ModePositive/negative ion switching acquisition
Quantification UnitStandard-curve absolute quantification, ng/mL or ng/g
QCPooled QC samples inserted across the batch to monitor signal drift and stability

Sample Requirements

SAMPLE REQUIREMENTS
Serum / Plasma
50 μL
Tissue
30 mg
Cells
1–5 × 10⁶ cells
Feces / Gut Content
100 mg fresh / 20 mg lyophilized
Urine
50 μL
Exosomes
50 μL
Replicates: cell / microbial samples ≥6 replicates per group; animal samples ≥10 per group; clinical samples ≥50 per group with strictly controlled inclusion criteria. Sampling site, timing and handling must be consistent between experimental and control groups.
Shipping notes: applicable to serum/plasma, various tissues, feces and gut content, urine, saliva, cells / cell culture medium and more. Recommended amounts are for a single experiment — please ship 2–3× the recommended amount; keep sampling sites consistent across groups for tissue samples; ship on dry ice or cold chain.

Workflow

WORKFLOW
1
Consultation
Study goals / panel selection
2
Proposal & Quote
Targets / timeline / agreement
3
Sample Intake
Cold chain / pre-check / labeling
4
Experiment
Acquisition / QC
5
Delivery
Quantification + interpretation + raw data
Deliverables: redox-pair ratios and oxidative-state assessment · absolute-quantification table for each metabolite (concentration + units) · group-wise T-test and fold-change analysis · PCA / PLS-DA modeling and hierarchical clustering · KEGG annotation and pathway enrichment · full analysis report and raw data.

Analysis Examples

ANALYSIS EXAMPLES
Example figures are generated from real project data; actual figures and analyses depend on the detection panel and study plan.
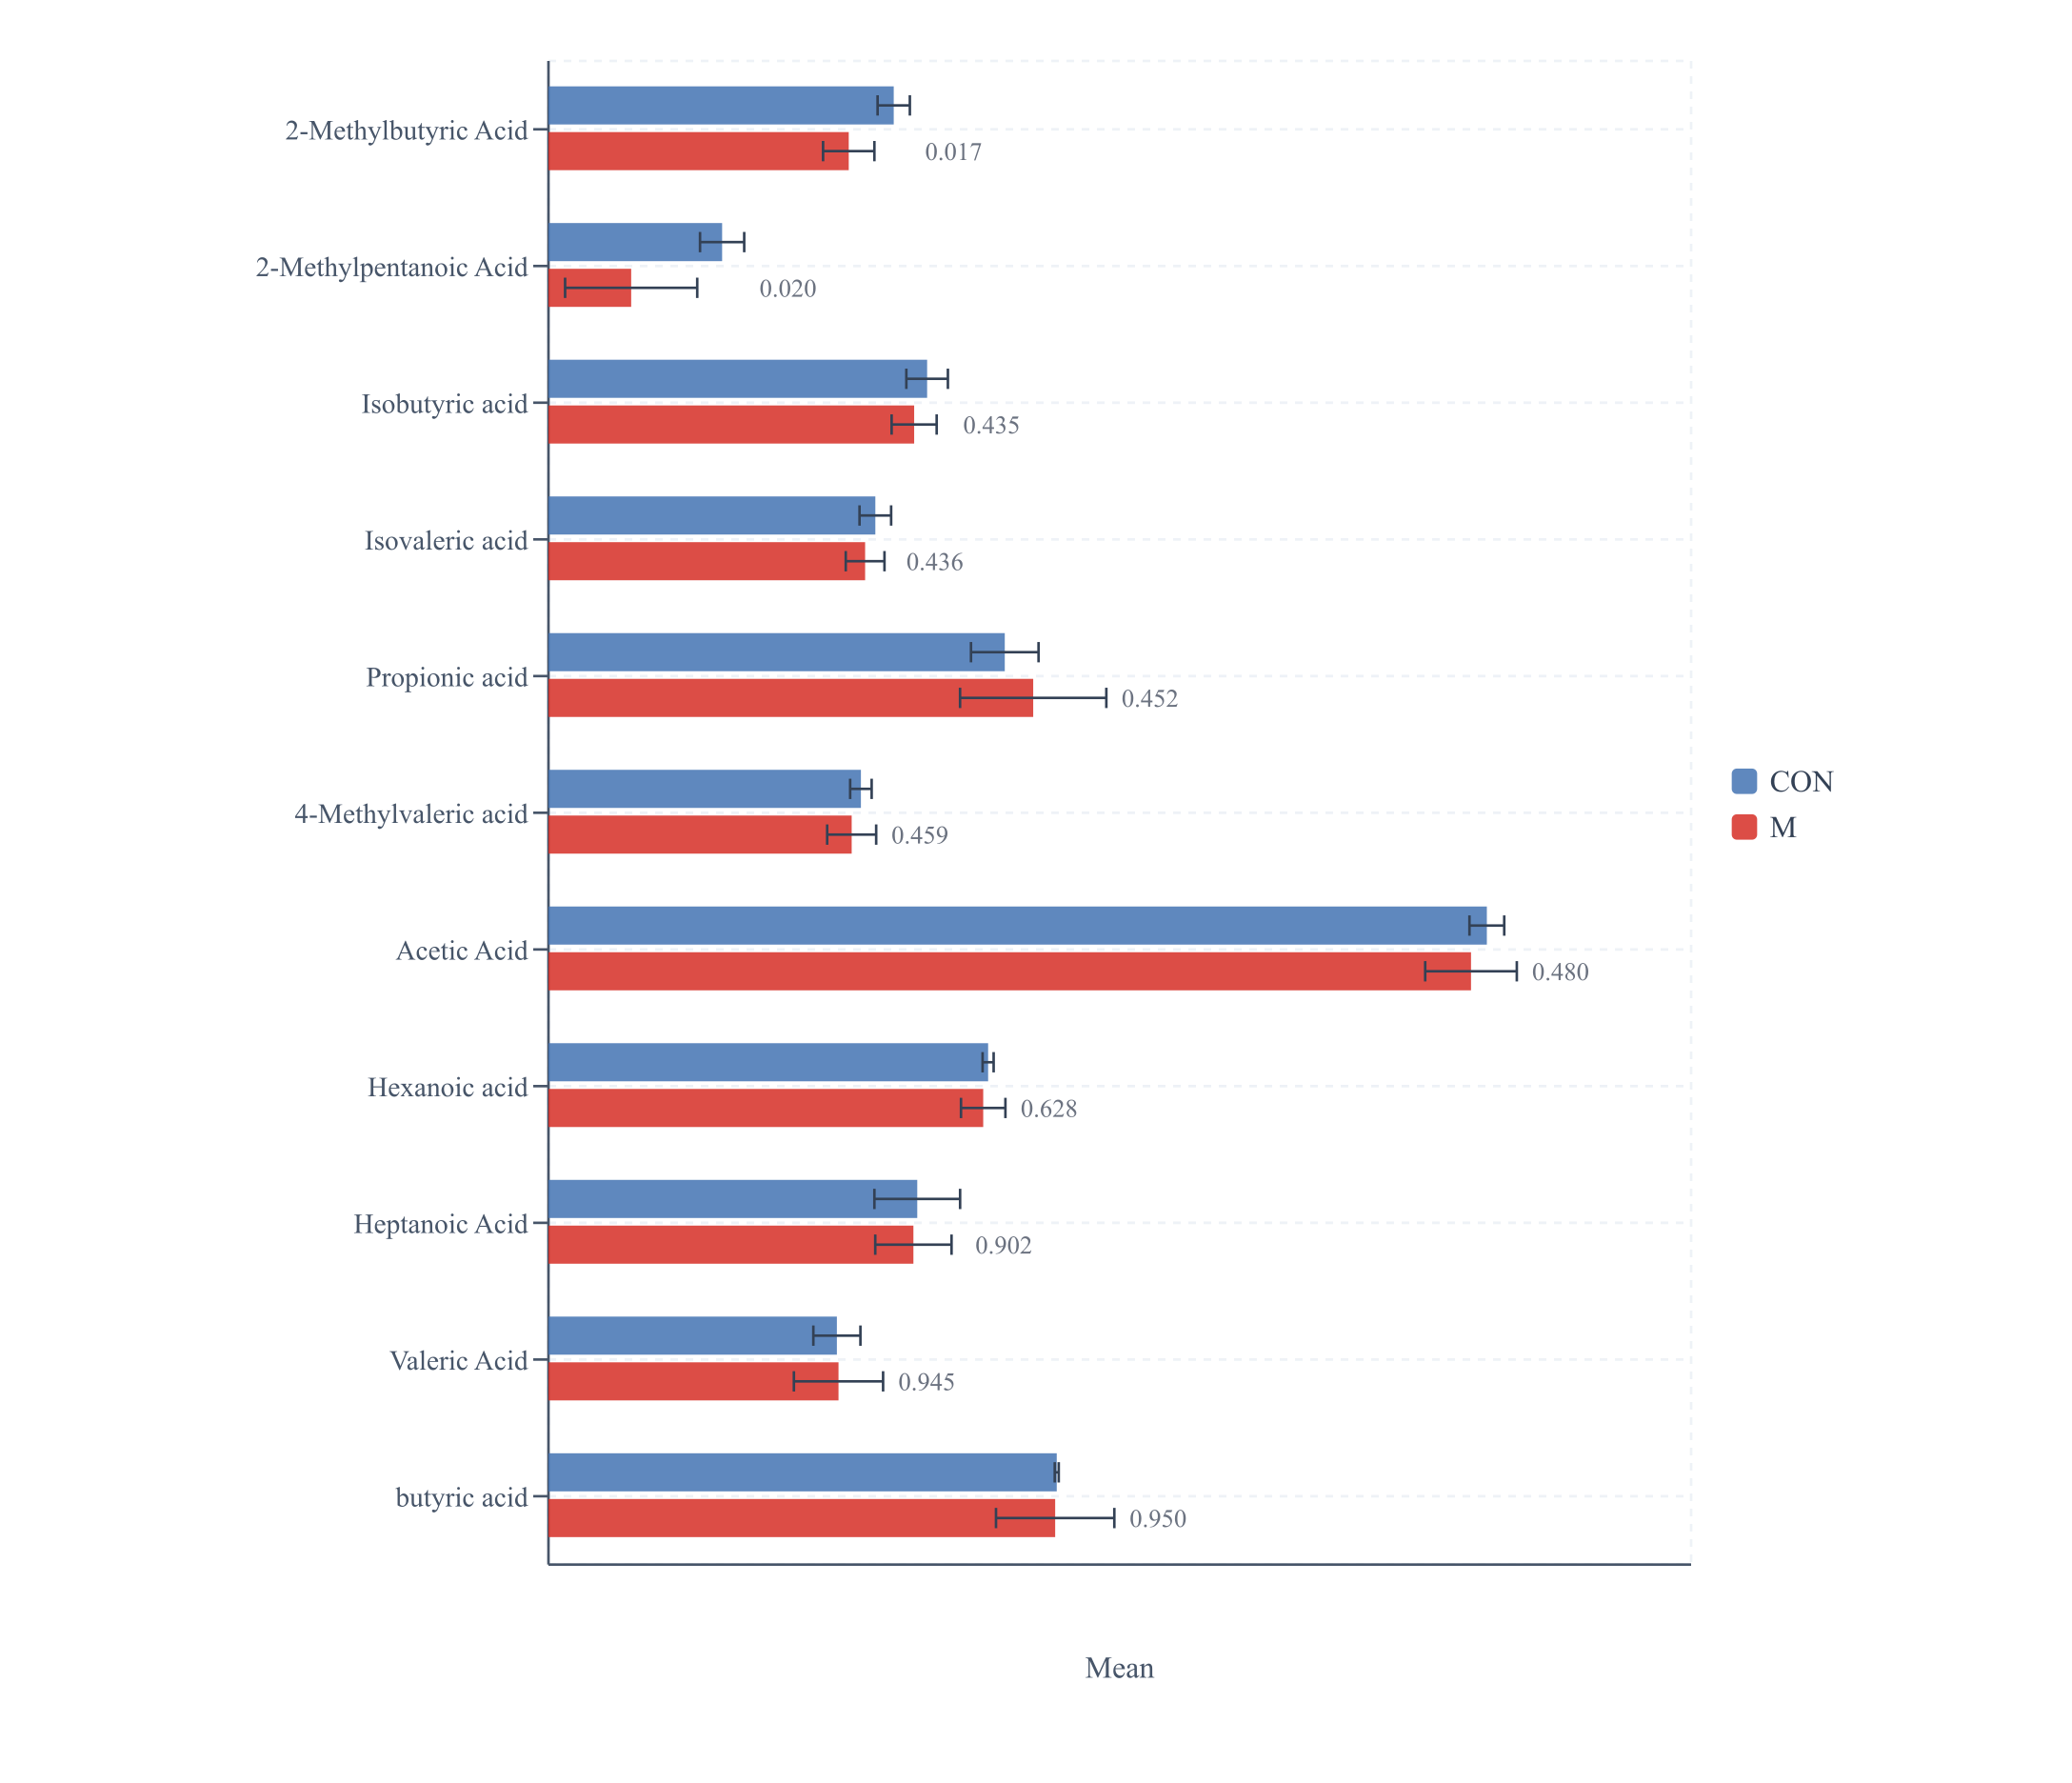
T-test Bar Chart
T-test Bar Chart
All metabolites sorted by ascending p-value; grouped bars show group means ± SD with p-values annotated beside the bars.
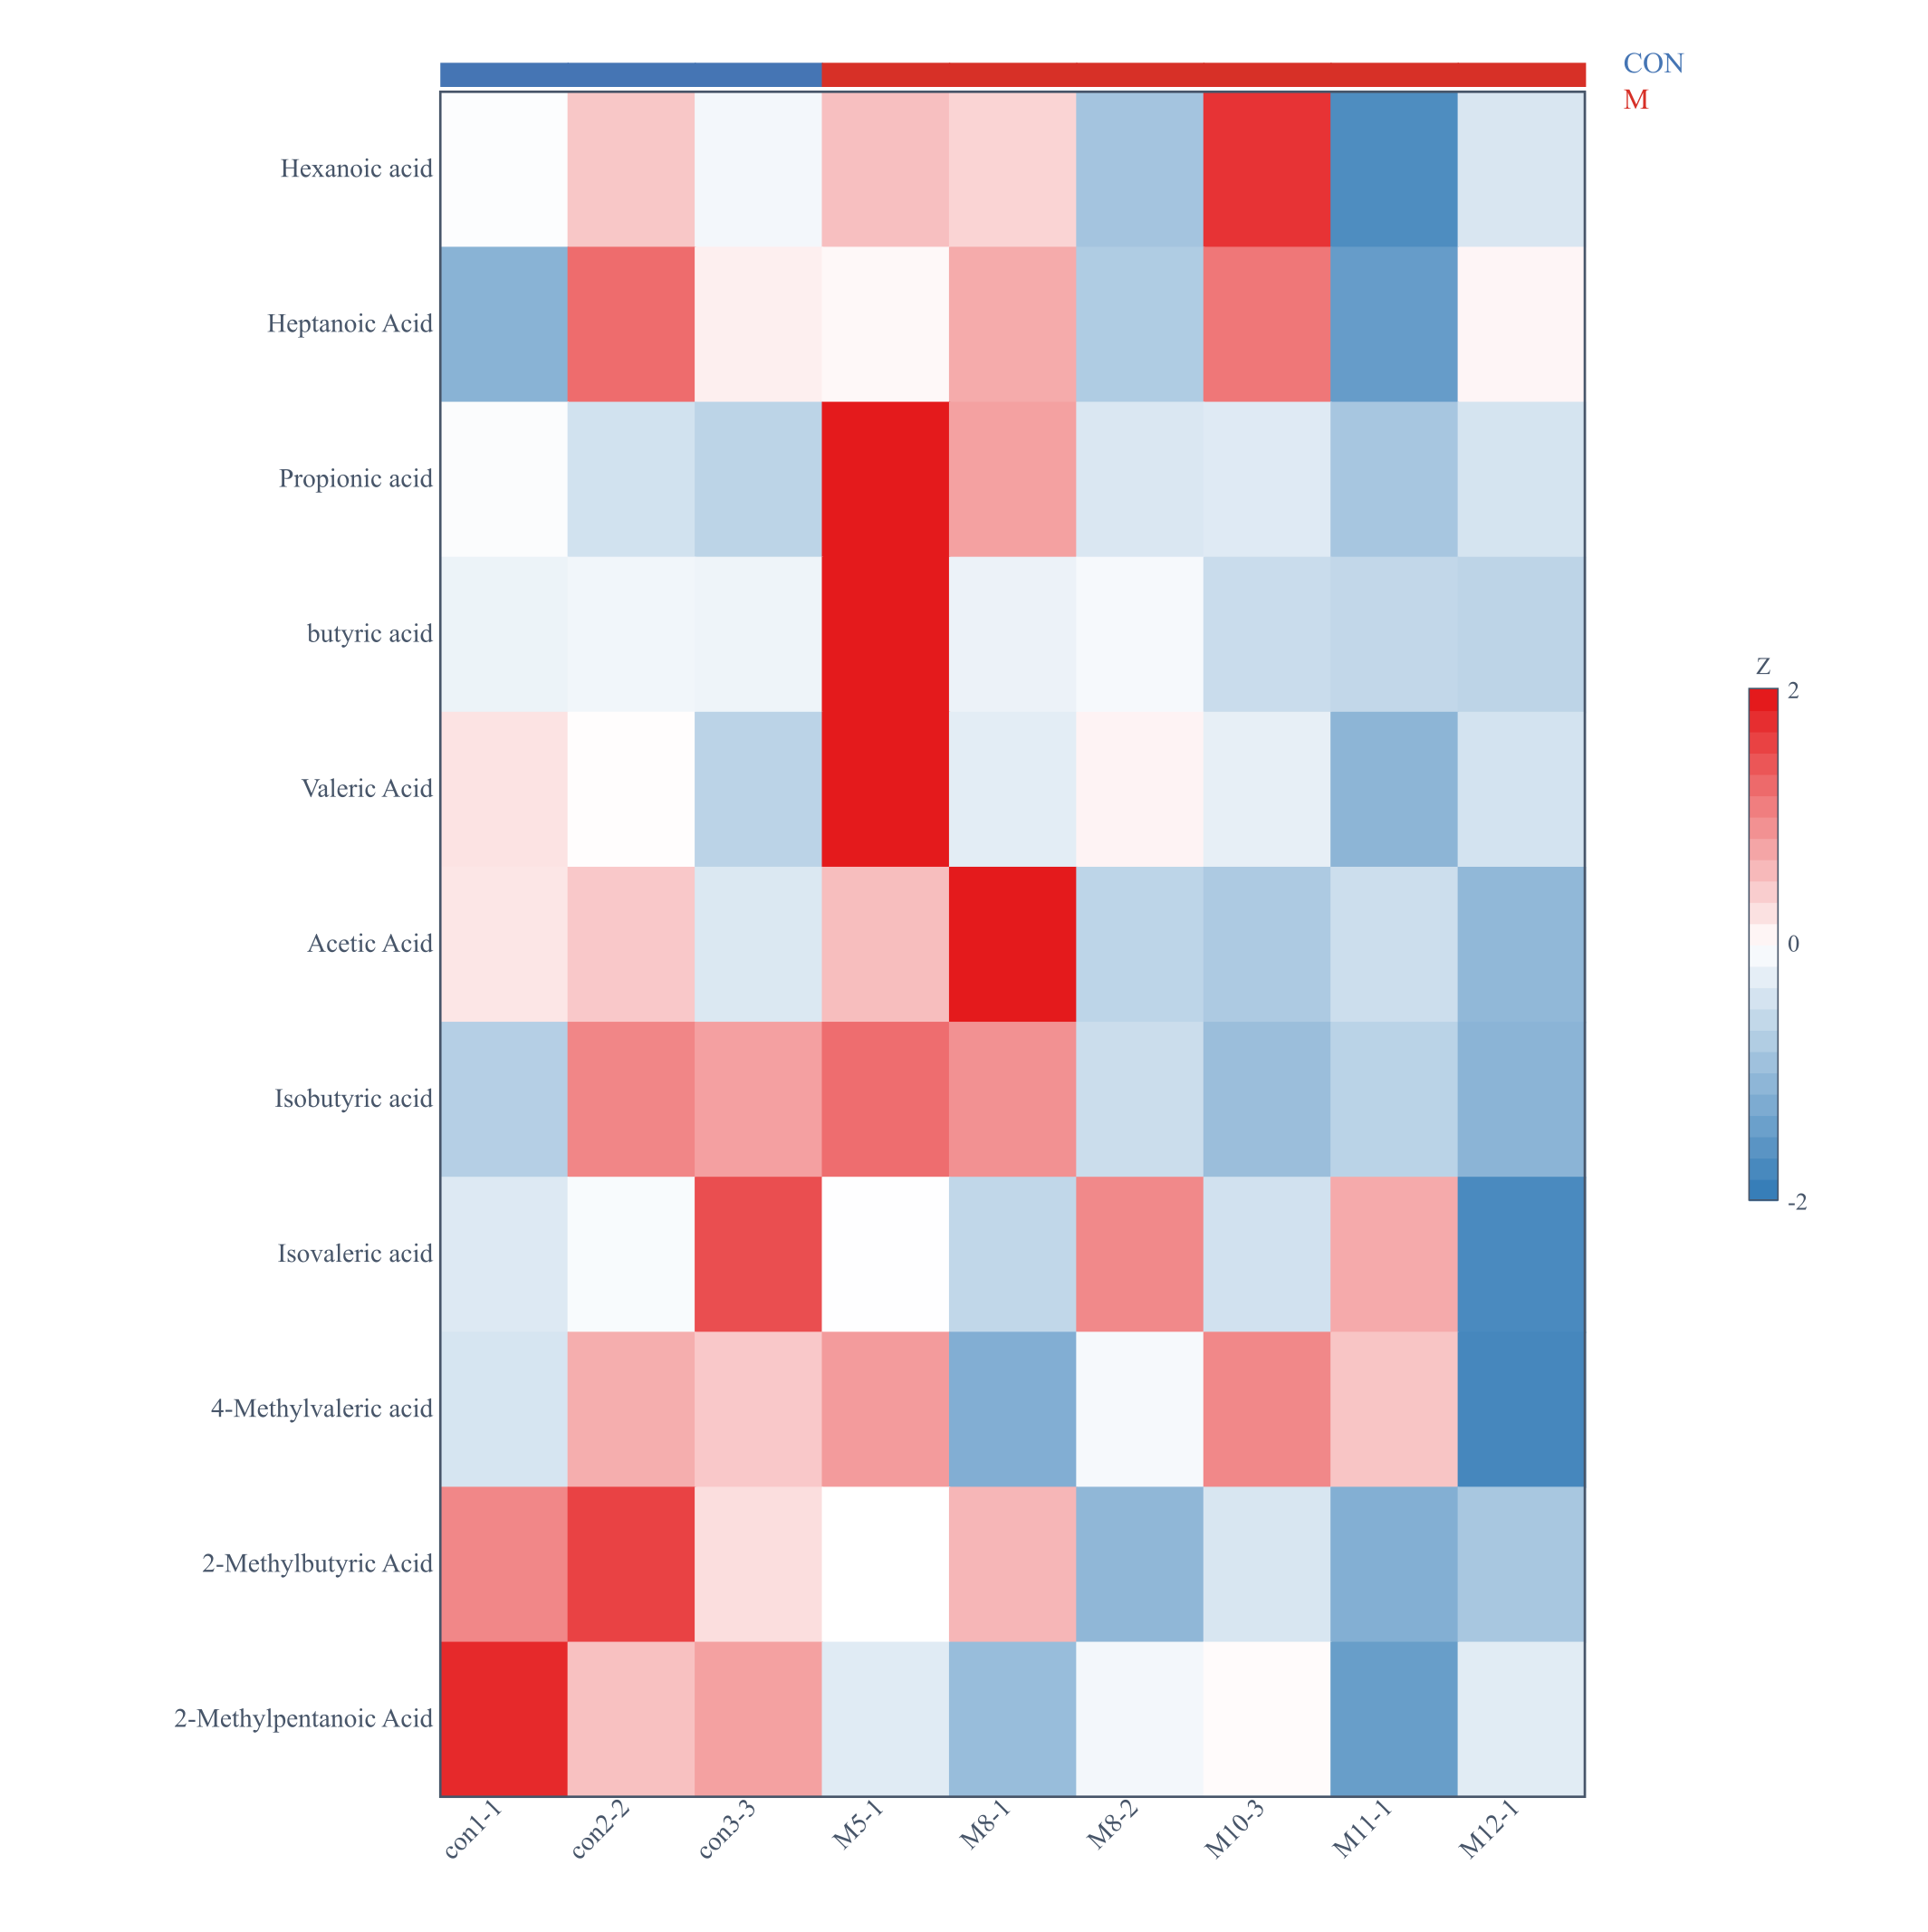
Hierarchical Clustering Heatmap
Z-score normalized abundance patterns of all metabolites; rows ordered by hierarchical clustering — red for high, blue for low abundance.
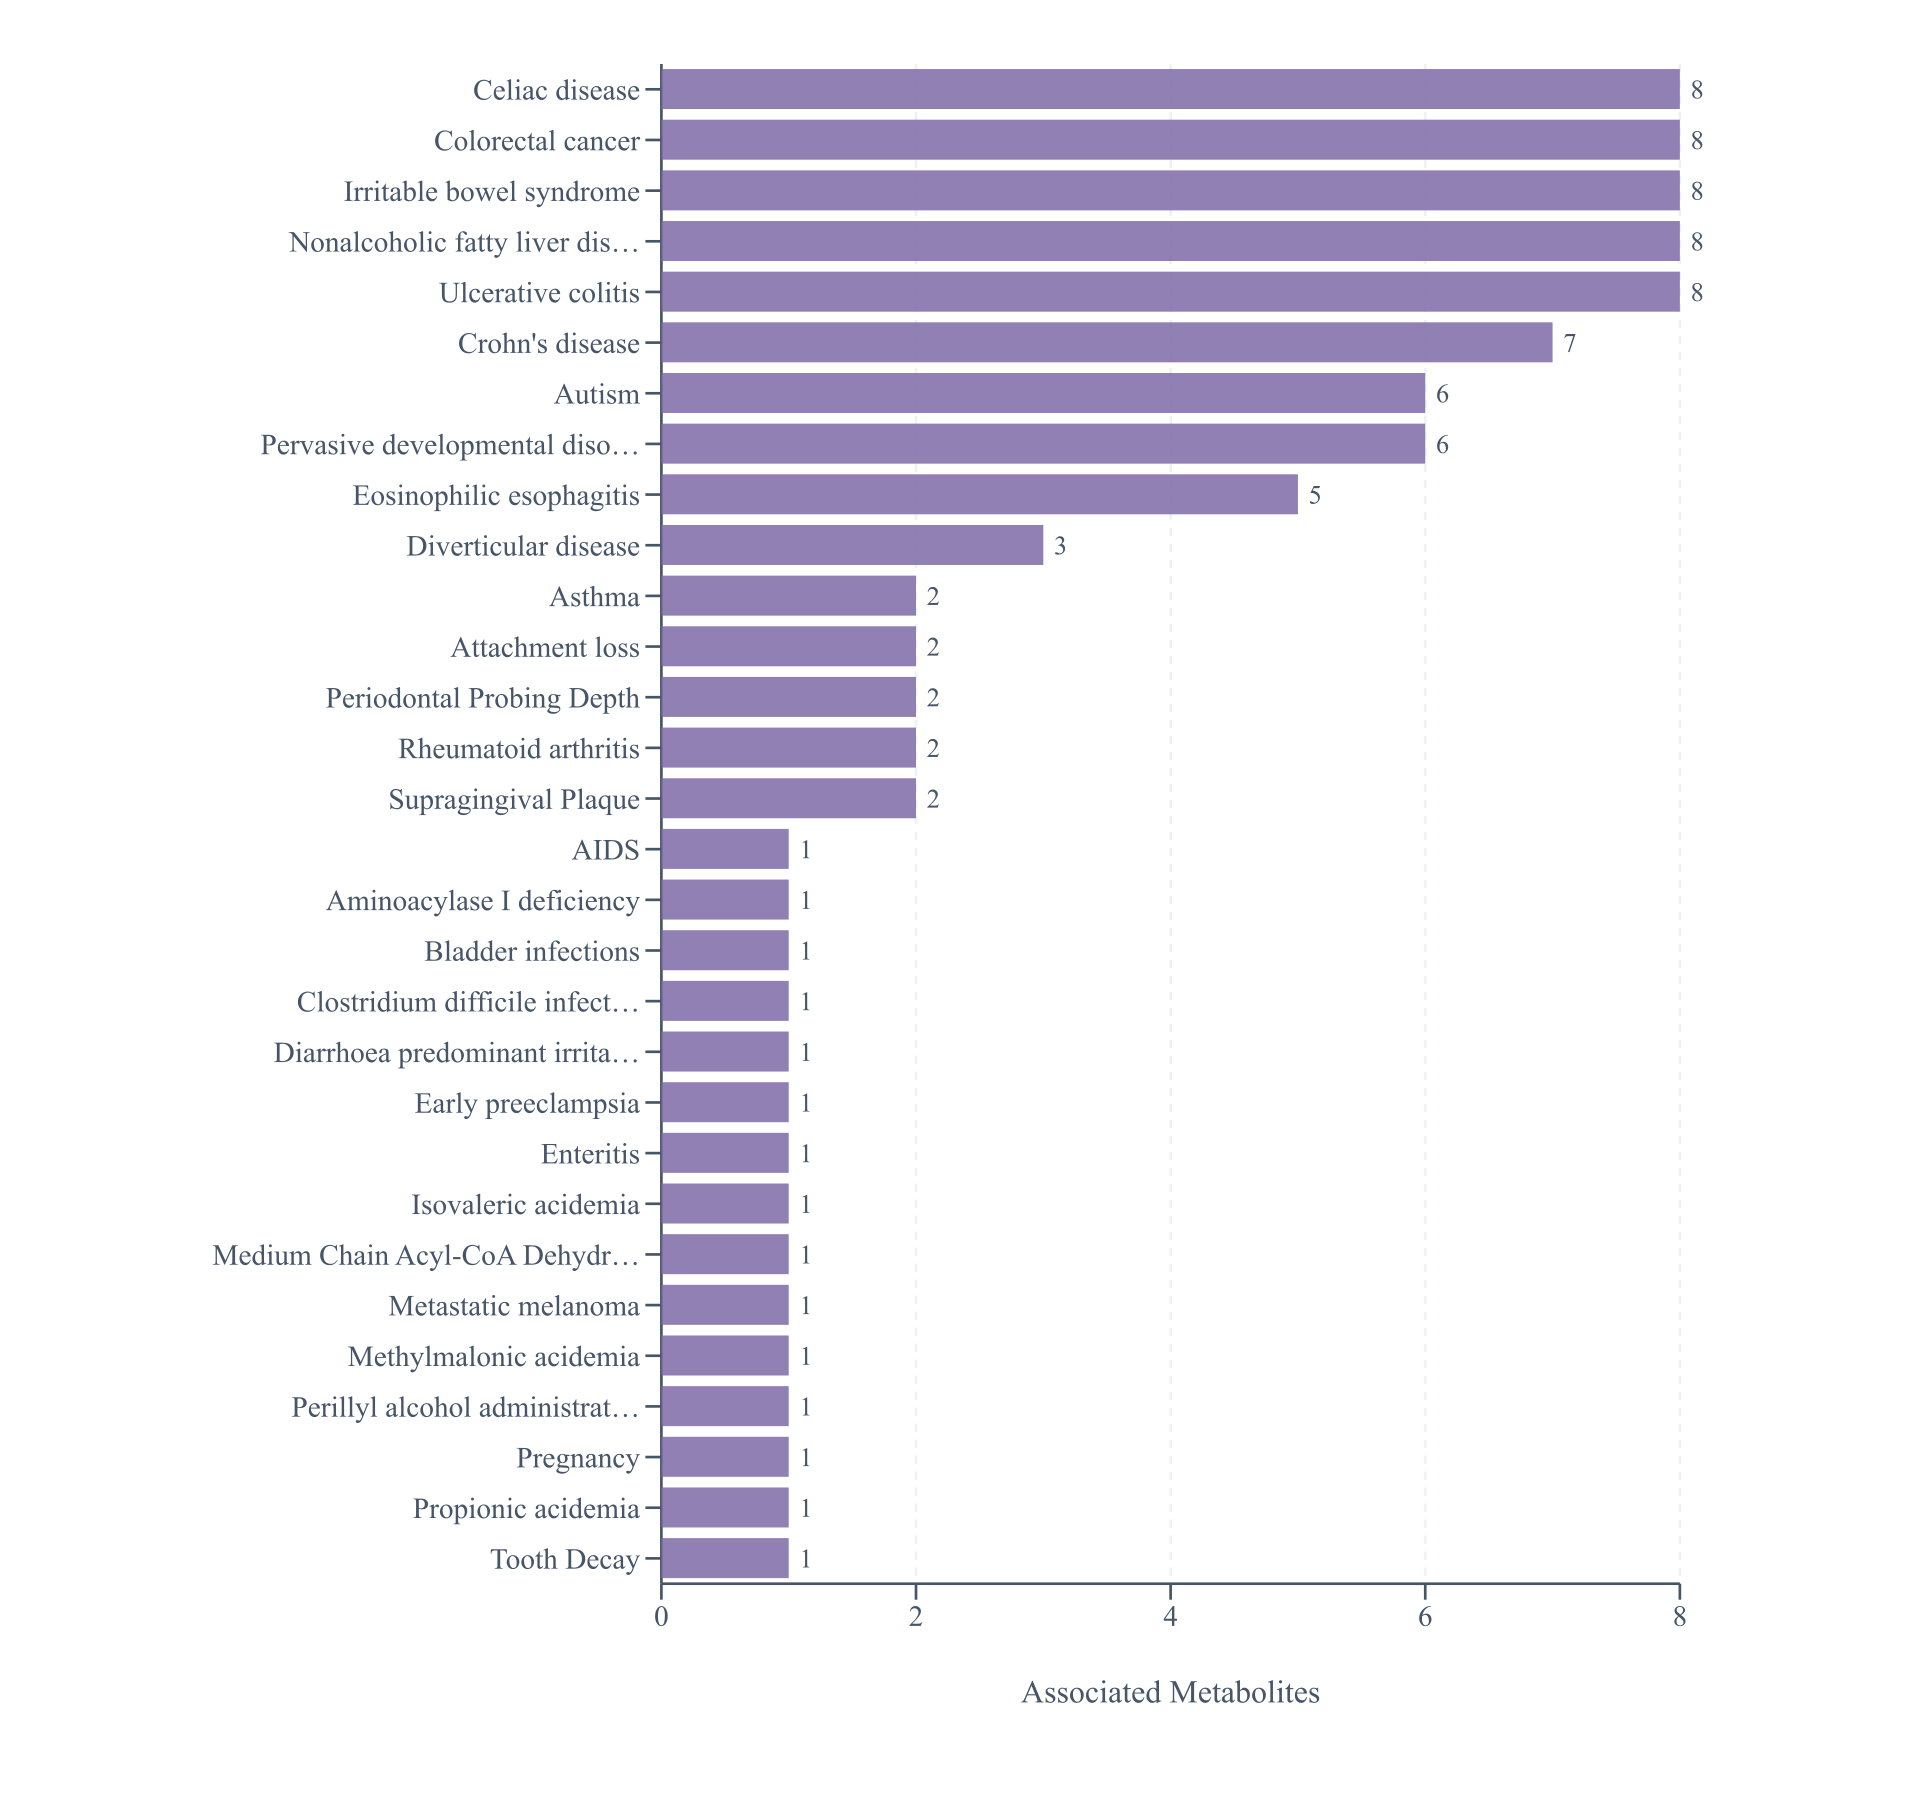
Disease Association Bar Chart
Known metabolite–disease associations mined from HMDB and other databases, ranked by the number of associated metabolites.
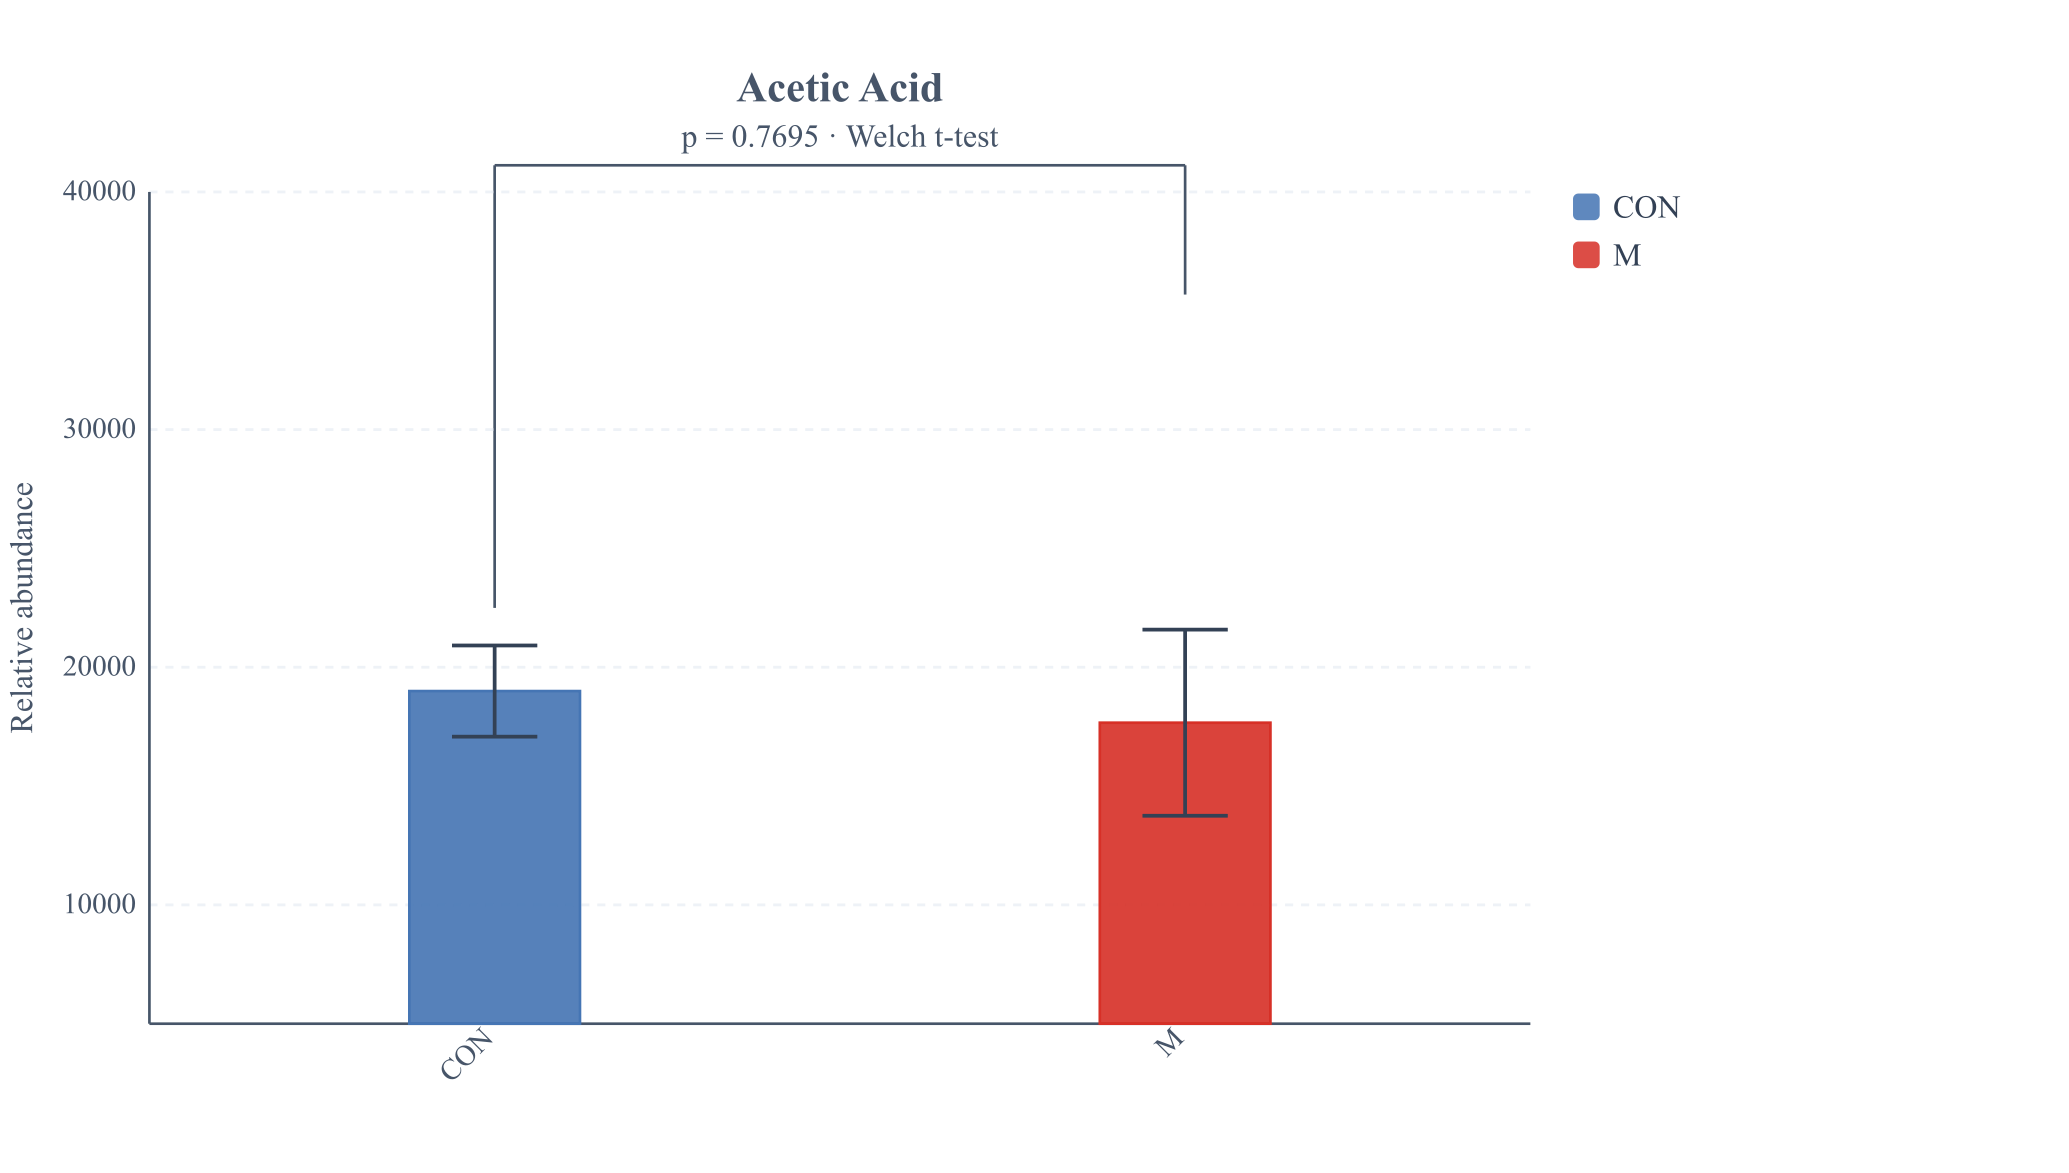
Metabolite Abundance Analysis
Faceted boxplots of significantly different metabolites between groups; intergroup comparison by Welch's t-test.
Bar Chart Analysis
Bar Chart Analysis
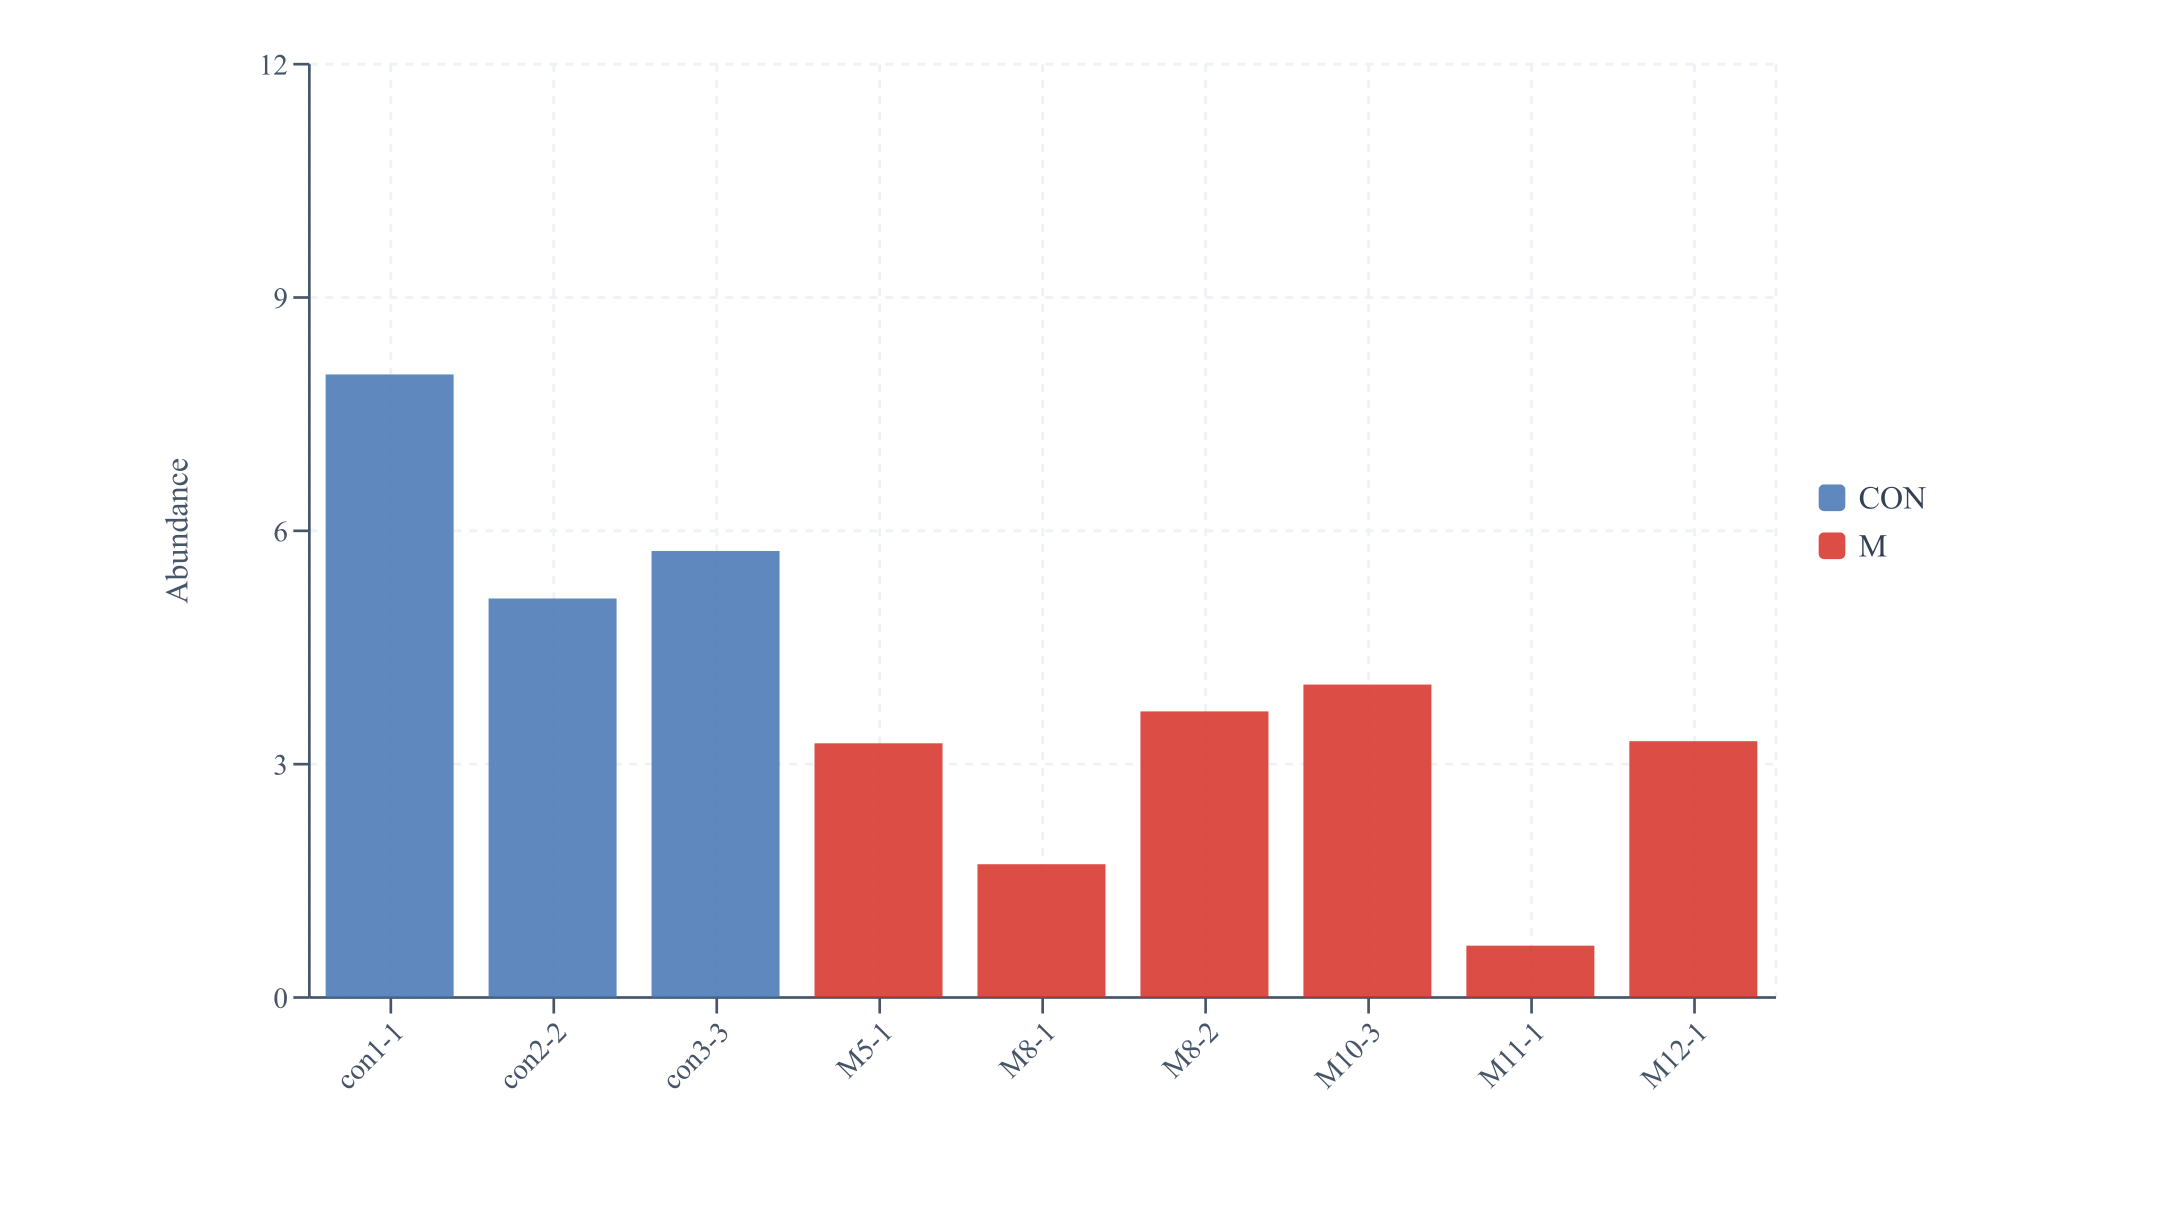
Per-sample bar charts of differential metabolites, visualizing group differences and individual dispersion.

References

REFERENCES
[1] GOODMAN R P, CALVO S E, MOOTHA V K. Spatiotemporal compartmentalization of hepatic NADH and NADPH metabolism[J]. Journal of Biological Chemistry, 2018, 293(20): 7508-7516.
[2] CHEN X, LEE J, WU H, et al. Mass Spectrometry in Advancement of Redox Precision Medicine[J]. Advances in Experimental Medicine and Biology, 2019, 1140: 327-358.

Applications

APPLICATIONS
Oxidative-stress level assessmentAntioxidant-defense system researchAging and degenerative diseasesDrug oxidative-toxicity evaluationExercise redox research

FAQ

FAQ
How long does a Redox Metabolites Panel project take?
Mature targeted panels typically take 1-3 weeks; untargeted projects take 2-4 weeks (counted from sample receipt and QC approval). The exact timeline is confirmed in writing before project start, and progress is trackable on the OmicsHub cloud platform.
What if my sample amount is below the recommendation?
Please do not dilute your samples. Low-input samples can often be accommodated by adjusting the preparation workflow — tell us the actual amount and our technical team will assess feasibility and note adjustments in the study plan.
Can I add targets to an existing panel?
Yes. Mature panels support on-demand additions; novel analytes outside the list can be implemented through custom method development (requires standards and extra validation time) — see our Custom Targeted Metabolomics service.
What samples do you need for Redox Metabolites Panel?
Serum/plasma ≥100 μL (fasting, no haemolysis), tissue ≥50 mg (snap-frozen), cells ≥1×10⁶ (medium washed off), urine ≥200 μL. Keep fasting time consistent, aliquot into single-use volumes and avoid freeze–thaw. Full guidance: Technical Resources → Sample Guide.

Delivery timing: sample shipping, customs declaration and similar steps may extend turnaround; actual project timelines prevail.

Request a Quote or Study Design

Tell us about your project — we reply within one business day (free assessment)

Used only for this enquiry; never shared.

Start Your Multi-omics Project

Free study design · Interactive execution · In-depth data interpretation

Official Channels
OFFICIAL CHANNELS
WeChat Official Account QR
Official Account
WECHAT OFFICIAL ACCOUNT
WeChat QR
WeChat Service
CUSTOMER SERVICE
Xiaohongshu QR
Xiaohongshu
XIAOHONGSHU
Call us:400-660-8826
WeChat QR
Scan to chat on WeChat