| Item | Details |
|---|---|
| Platform | Q Exactive HF-X high-resolution MS · polarity-switching acquisition |
| Identification Strategy | Dual matching against public databases and in-house libraries, covering polar and non-polar metabolites |
| Applicable Matrices | Blood (serum/plasma) · tissue · cells · urine and other matrices |
| Differential Screening | Default FC ≥ 1.5 and p < 0.05; or VIP ≥ 1 and q ≤ 0.05 (strategy auto-selected based on permutation-test results) |
| Module | Core Methods & Metrics | Key Outputs |
|---|---|---|
| Data Preprocessing | Peak picking, retention-time correction and alignment in Compound Discoverer; TIC normalization, missing-value filtering and imputation, Pareto scaling | Metabolic-feature quantification matrix |
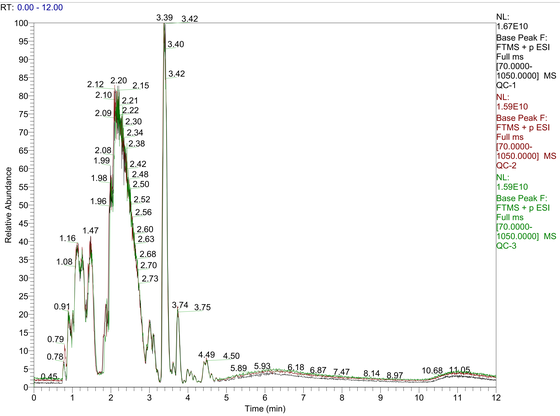
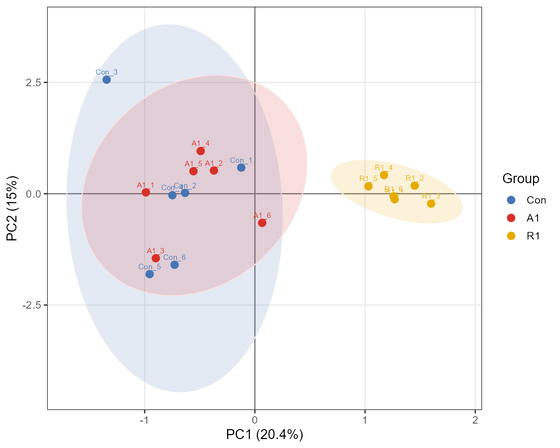
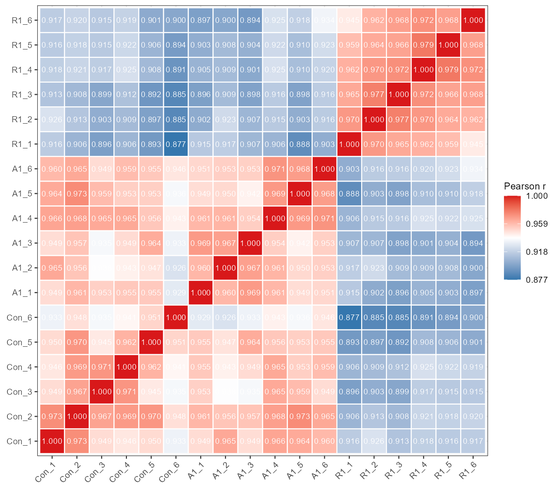
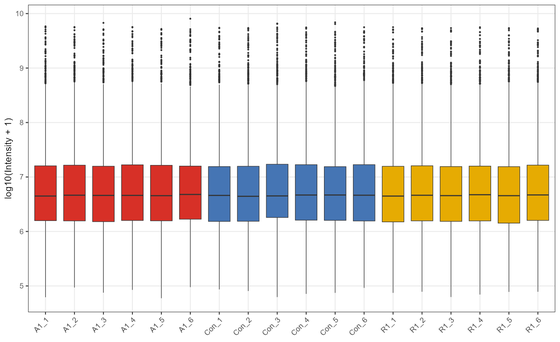
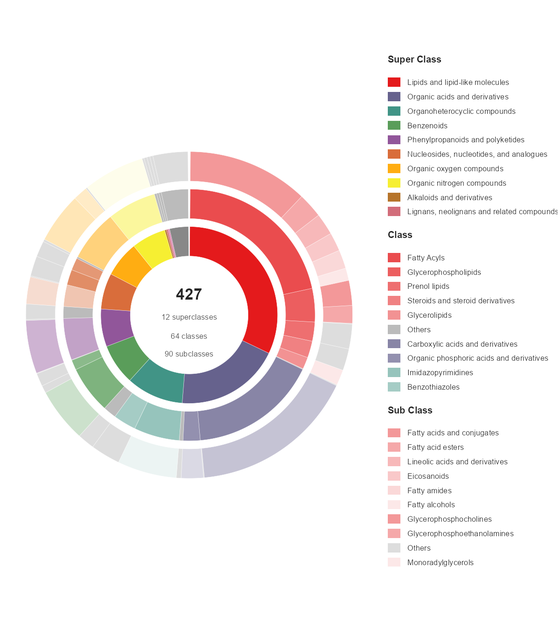
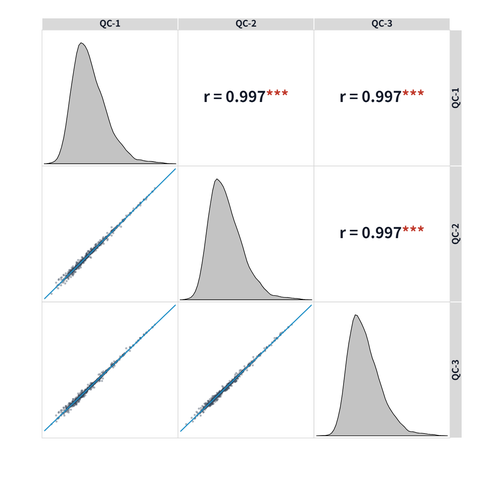
| Quality Control | Global PCA / PLS-DA, QC-sample correlations (generally > 0.99) and pairs plots, sample-intensity boxplots, HMDB level-3 classification statistics | QC figure sets, classification statistics tables |
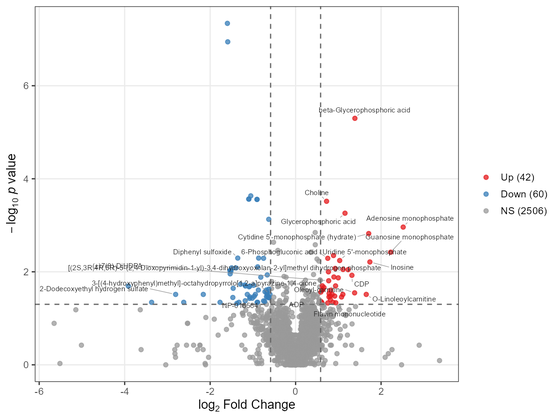
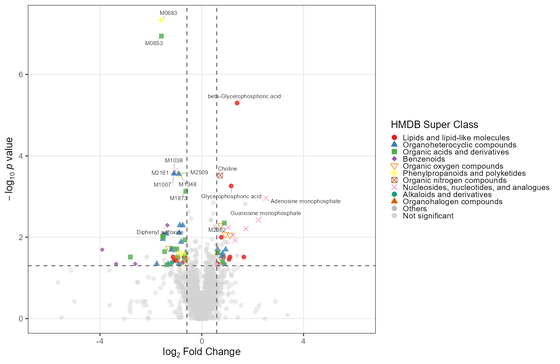
| Univariate Stats | Fold change; Welch's t-test / Wilcoxon test; BH-adjusted p-values (padj) | Volcano plots, classified volcano plots, full metabolite statistics tables |
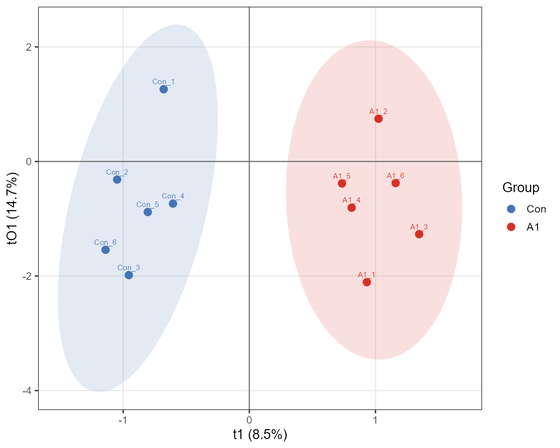
| Multivariate Stats | PCA / PLS-DA / OPLS-DA modeling; 200 permutation tests; VIP score calculation | Score plots, permutation-test plots, VIP Top-25 bar charts |
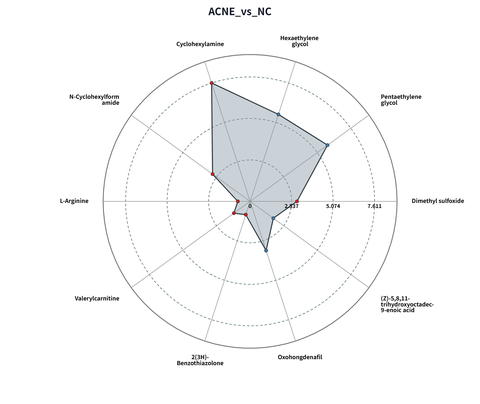
| Differential Screening | Default FC ≥ 1.5 and p < 0.05; or VIP ≥ 1 and q ≤ 0.05 (strategy auto-selected based on permutation-test results) | Differential metabolite lists, up/down-regulation counts |
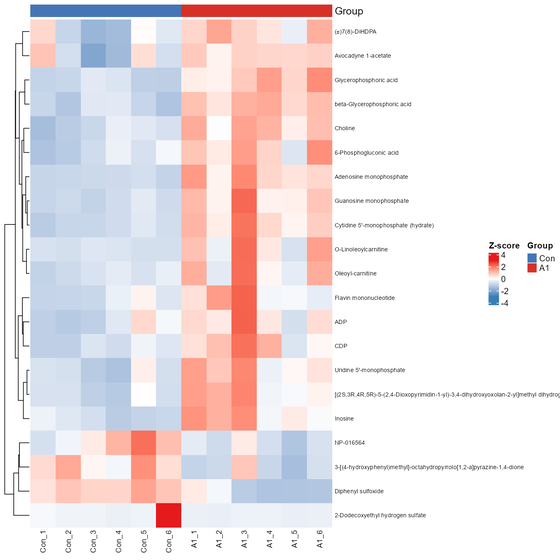
| Abundance Analysis | Hierarchical clustering; complex heatmap of top-50 significant metabolites; abundance analysis; Spearman correlation; Z-score normalization | Cluster heatmaps, correlation plots, abundance plots |
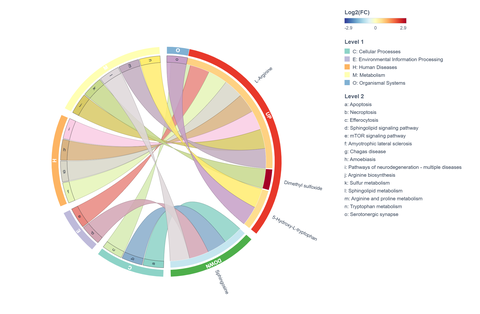
| Functional annotation | KEGG level 1–3 annotation and enrichment; Sankey diagrams, differential abundance score (DA Score), pathway-impact topology analysis, chord / donut plots / regulatory networks | KEGG enrichment figure sets and result tables |
| HMDB / SMPDB | HMDB and SMPDB enrichment; single-metabolite pathway analysis; pathway–metabolite networks | SMPDB enrichment figure sets and result tables |
| Disease & Biomarkers | Metabolite–disease association enrichment; ROC curves and AUC ranking; Venn overlap analysis of differential metabolites for multi-group comparisons | ROC plots, AUC ranking tables, Venn diagrams |
무료 실험 설계 · 실시간 진행 확인 · 심층 데이터 해석


납기 안내: 시료 운송, 통관 신고 등의 사유로 납기가 연장될 수 있으며, 실제 프로젝트 일정을 기준으로 합니다.
요청을 남겨주시면 1영업일 이내에 회신드립니다 (무료 검토)
Free study design · Interactive execution · In-depth data interpretation