| Item | Details |
|---|---|
| Sequencing Platform | Illumina MiSeq PE250(16S / 18S / ITS) |
| Analysis Strategy | OTU / ASV analysis, 50,000 reads per sample |
| Taxonomy Databases | RDP classifier Bayesian algorithm; reference databases Silva 138 (16S/18S) and Unite 7.0 (ITS); community composition statistics across 7 ranks (domain to species) |
| Functional Prediction | PICRUSt2 predicts functional abundance from marker genes (KEGG orthologs KO, EC enzyme classes) |
| Standard Delivery | Raw data + analysis report |
| Module | Core Methods & Metrics | Key Outputs |
|---|---|---|
| Data QC | PE reads merged by overlap; sequences are quality-controlled, filtered and demultiplexed before clustering/denoising and taxonomic analysis | Filtering statistics table, base-quality distribution plots |
| OTU Clustering | Non-redundant sequences extracted and singletons removed; OTUs clustered at 97% similarity with chimera removal during clustering | OTU abundance table, annotated OTU table, taxon statistics table |
| Taxonomy Annotation | Taxonomic annotation with the RDP classifier Bayesian algorithm; Silva 138 (16S/18S) and Unite 7.0 (ITS) reference databases; composition statistics across 7 ranks (domain/kingdom/phylum/class/order/family/genus/species) | Absolute / relative abundance tables at each taxonomic rank |
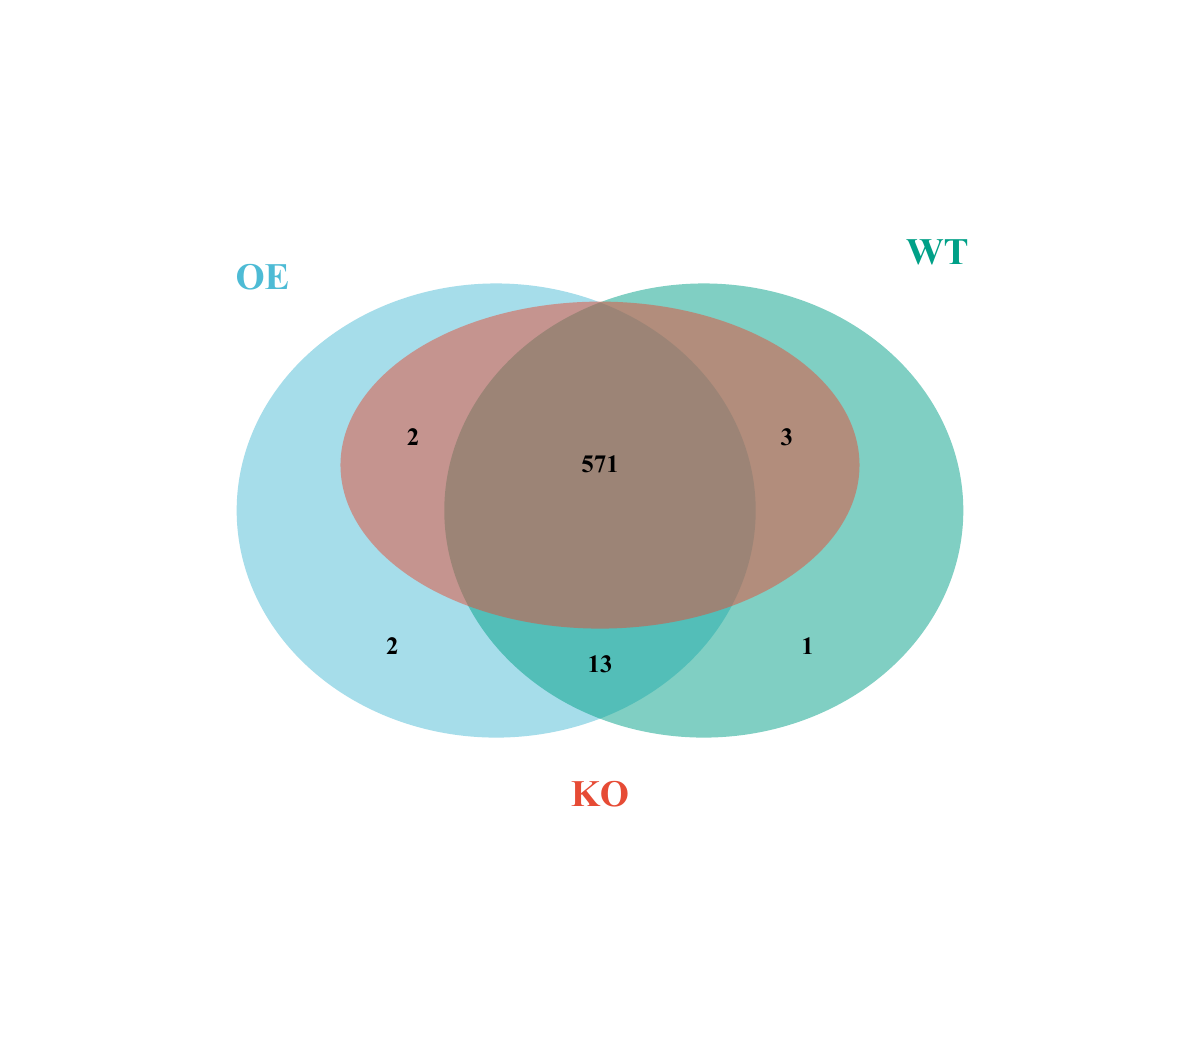
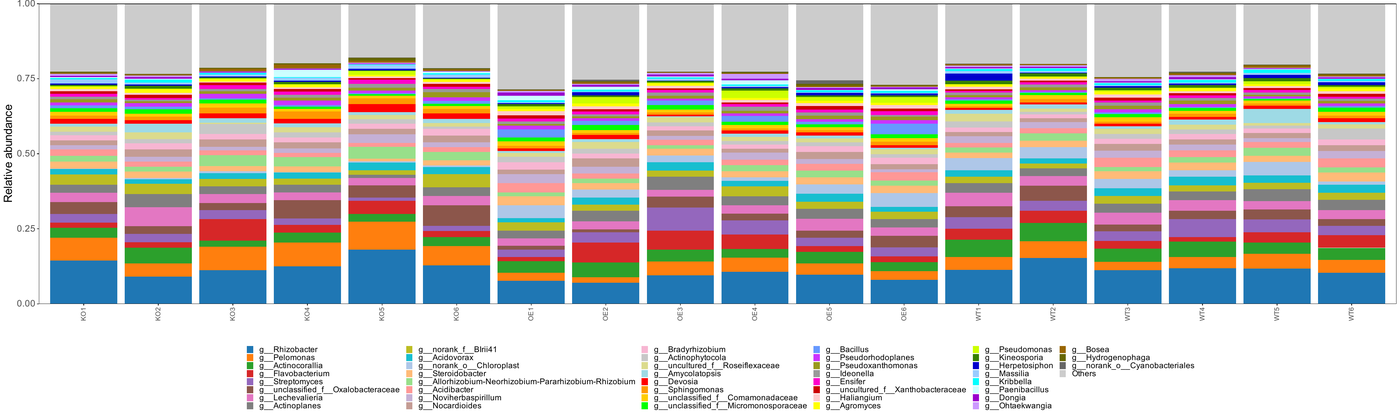
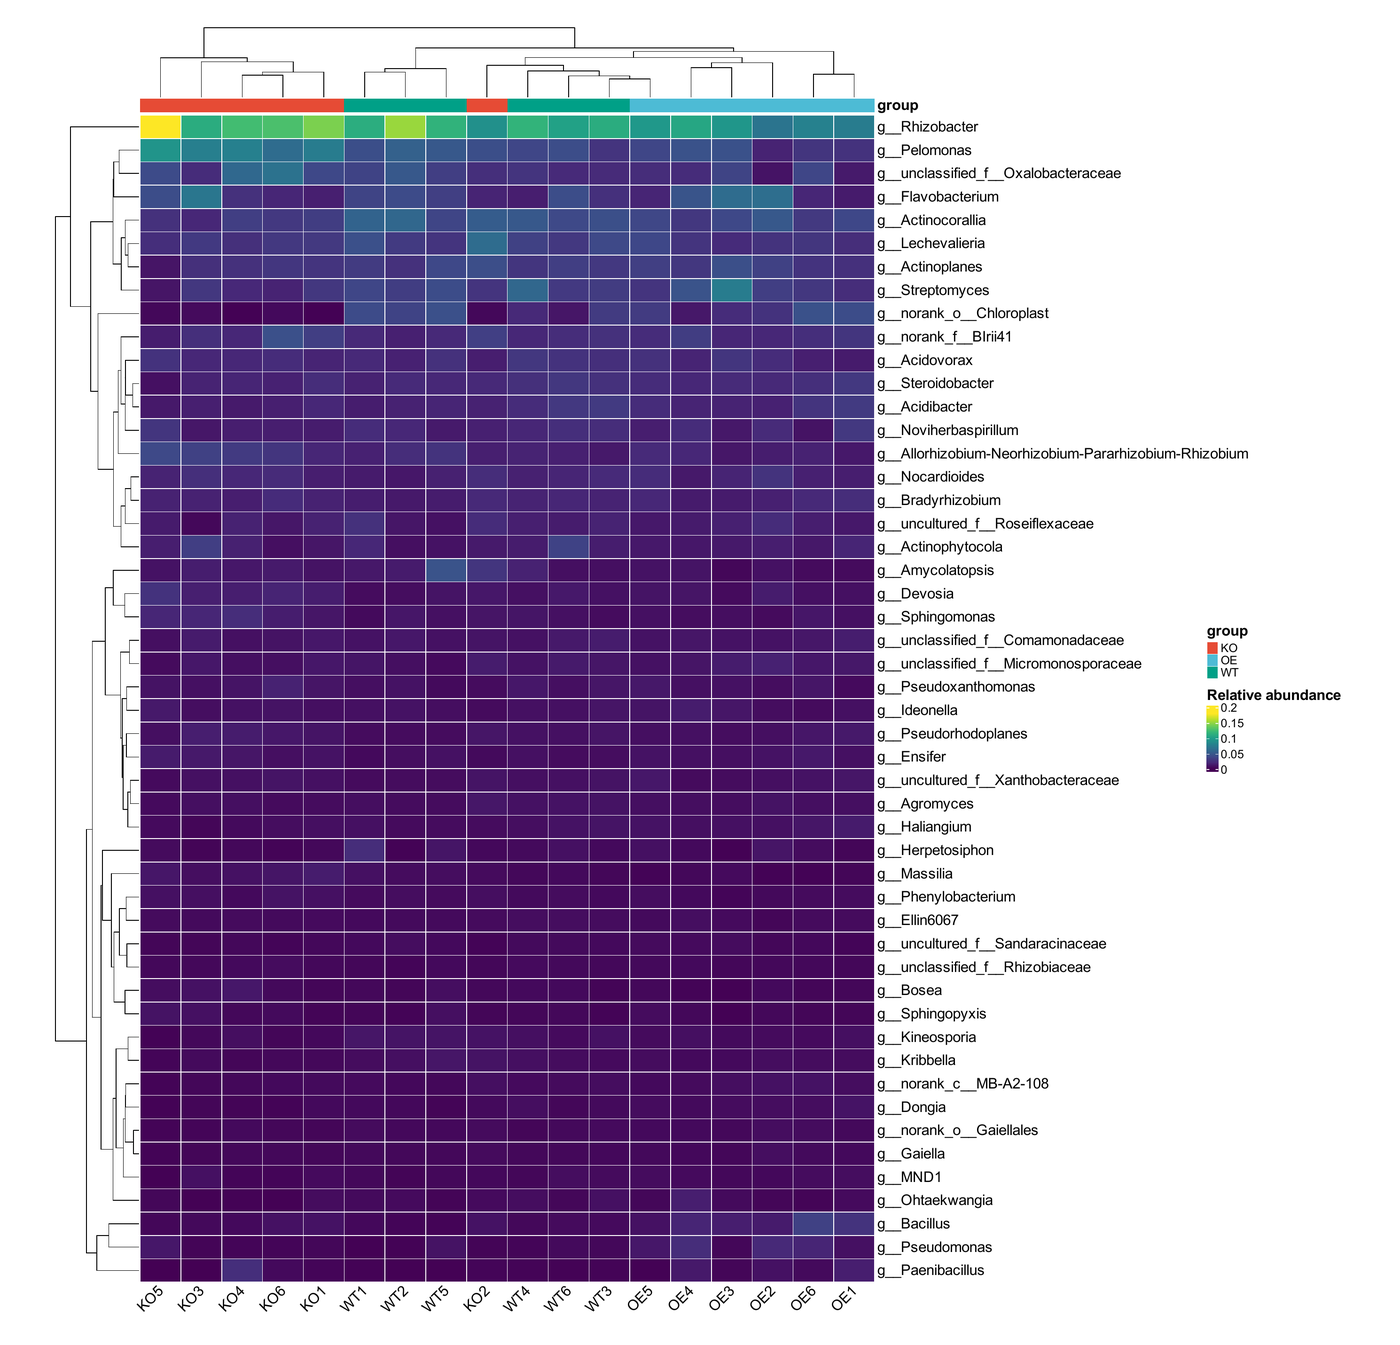
| Composition | Shared and unique OTU statistics between groups; community bar plots at each taxonomic level; abundance heatmap with two-way clustering of taxa and samples | Venn diagram, community bar plots, heatmap |
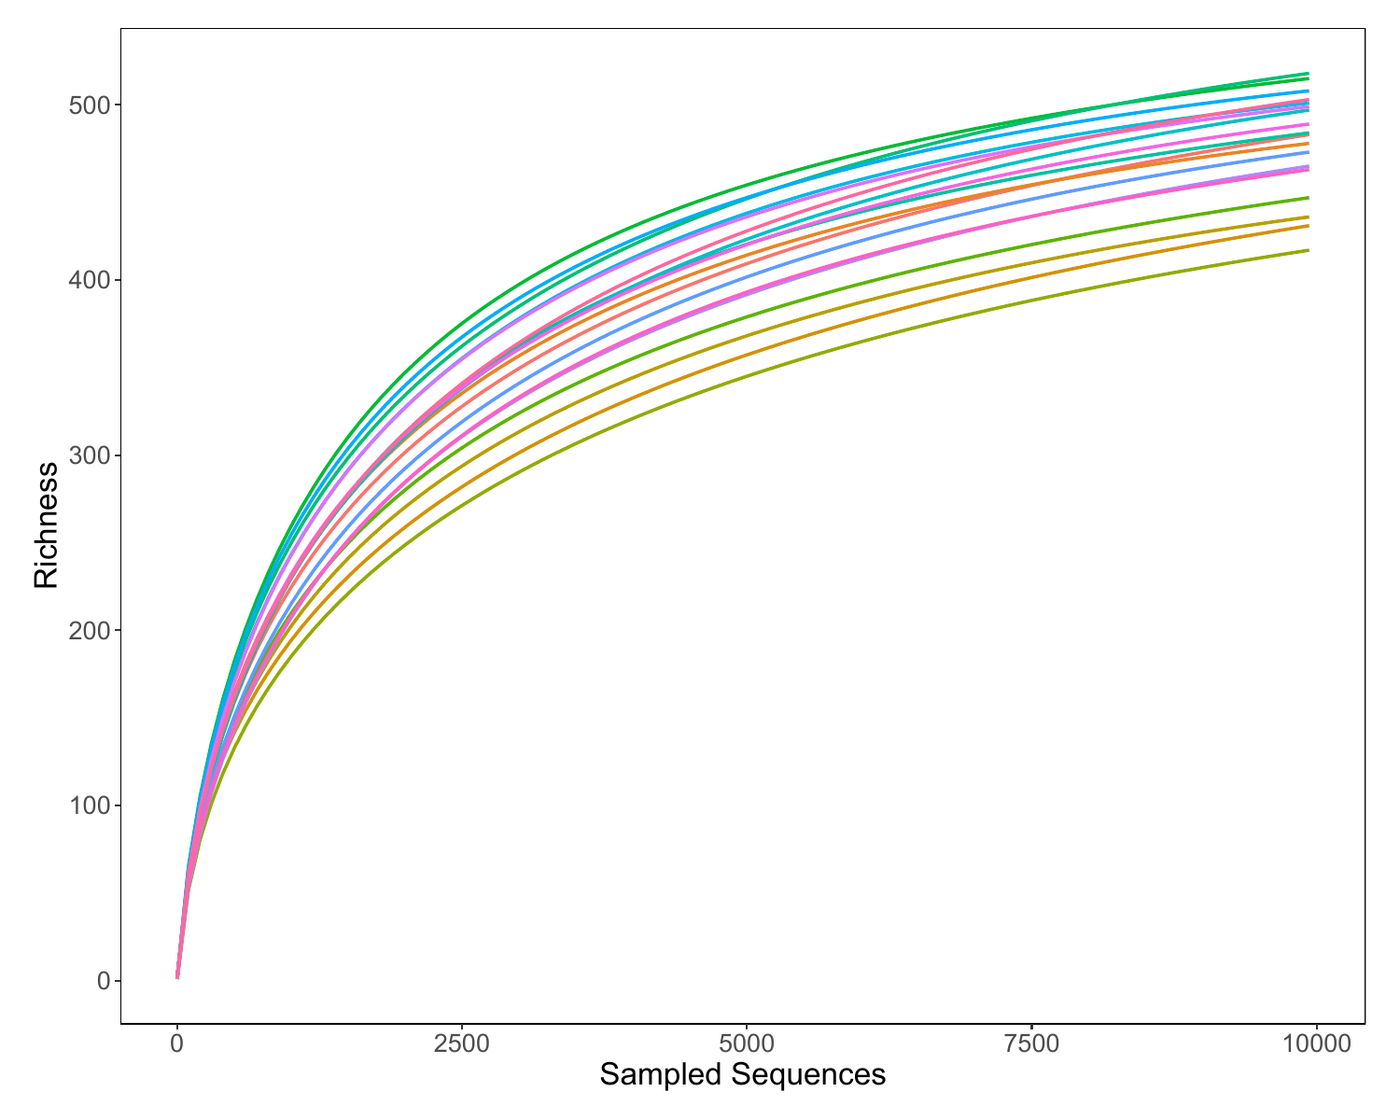
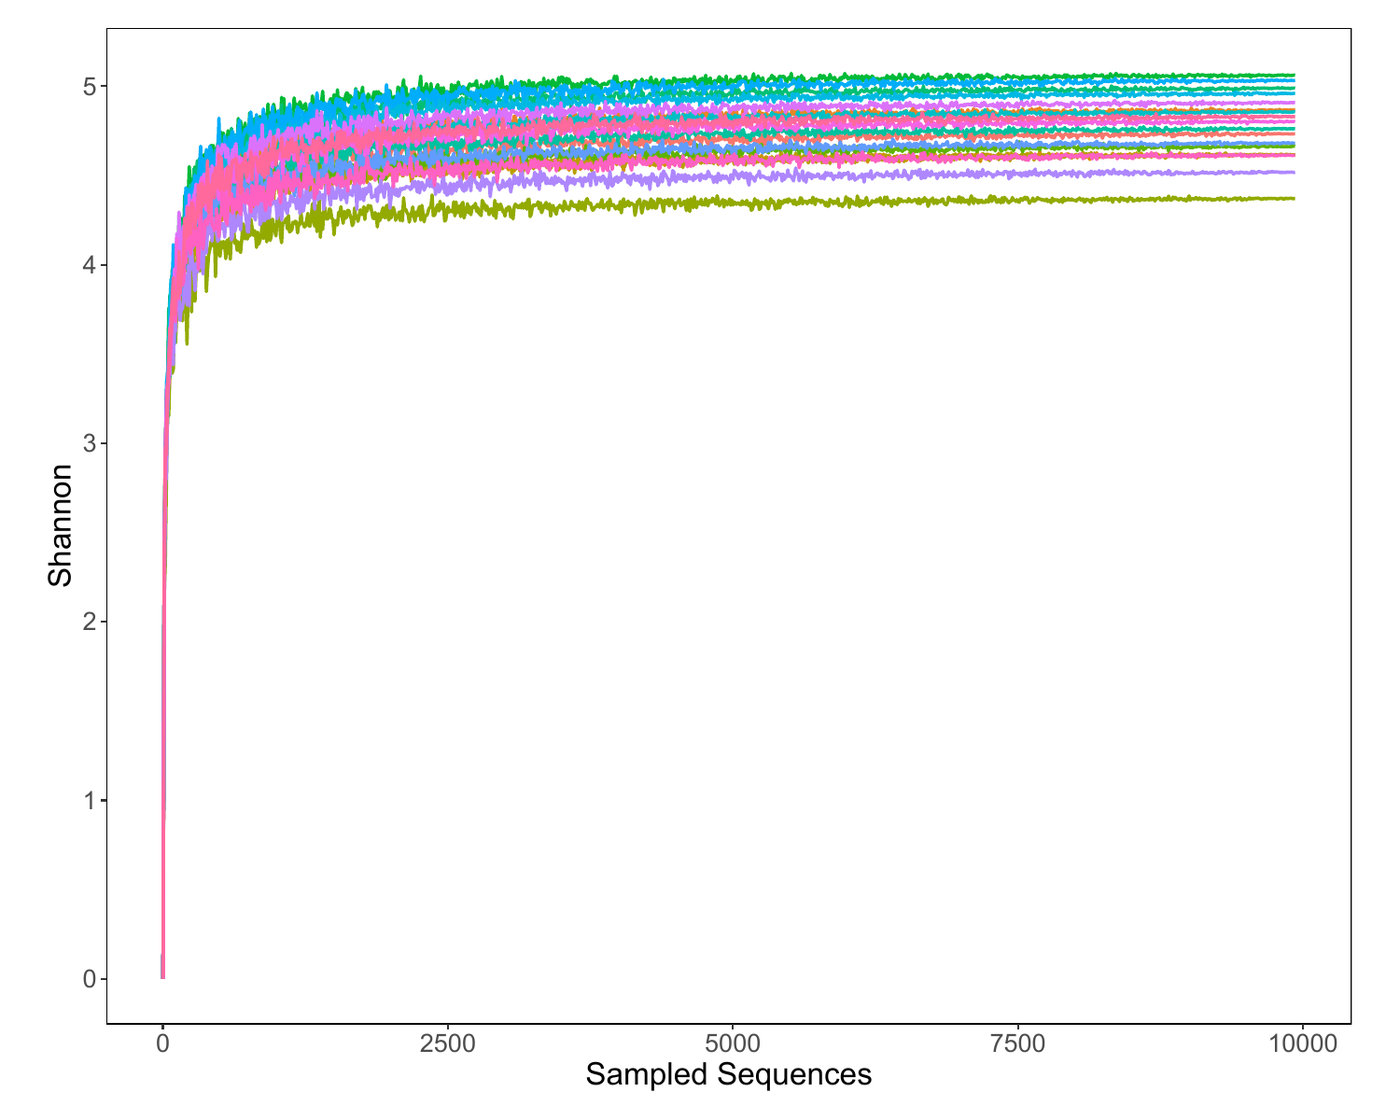
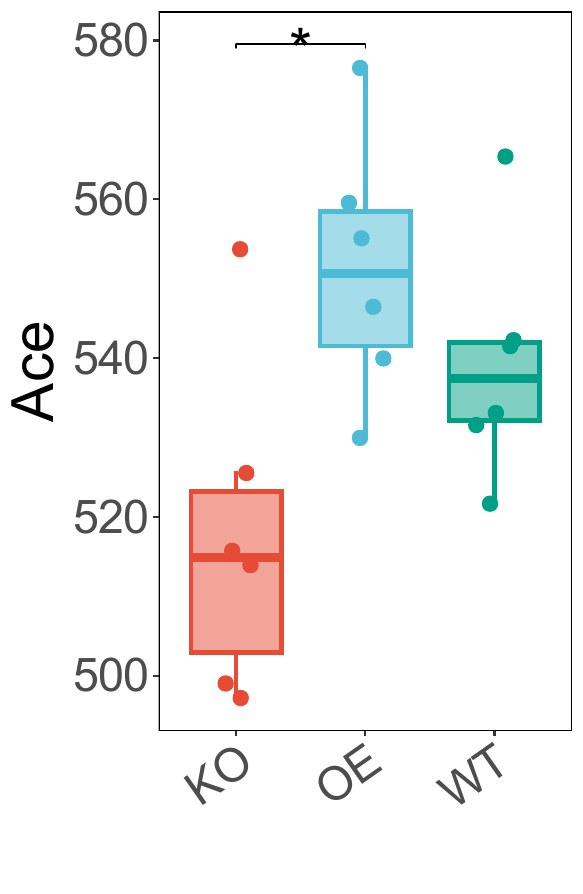
| Alpha Diversity | Richness (Chao1/Ace), diversity (Shannon/Simpson), evenness (Pielou), phylogenetic diversity (PD) and coverage; rarefaction, Shannon-Wiener and rank-abundance curves | Three curve plots, intergroup boxplots of indices and test tables |
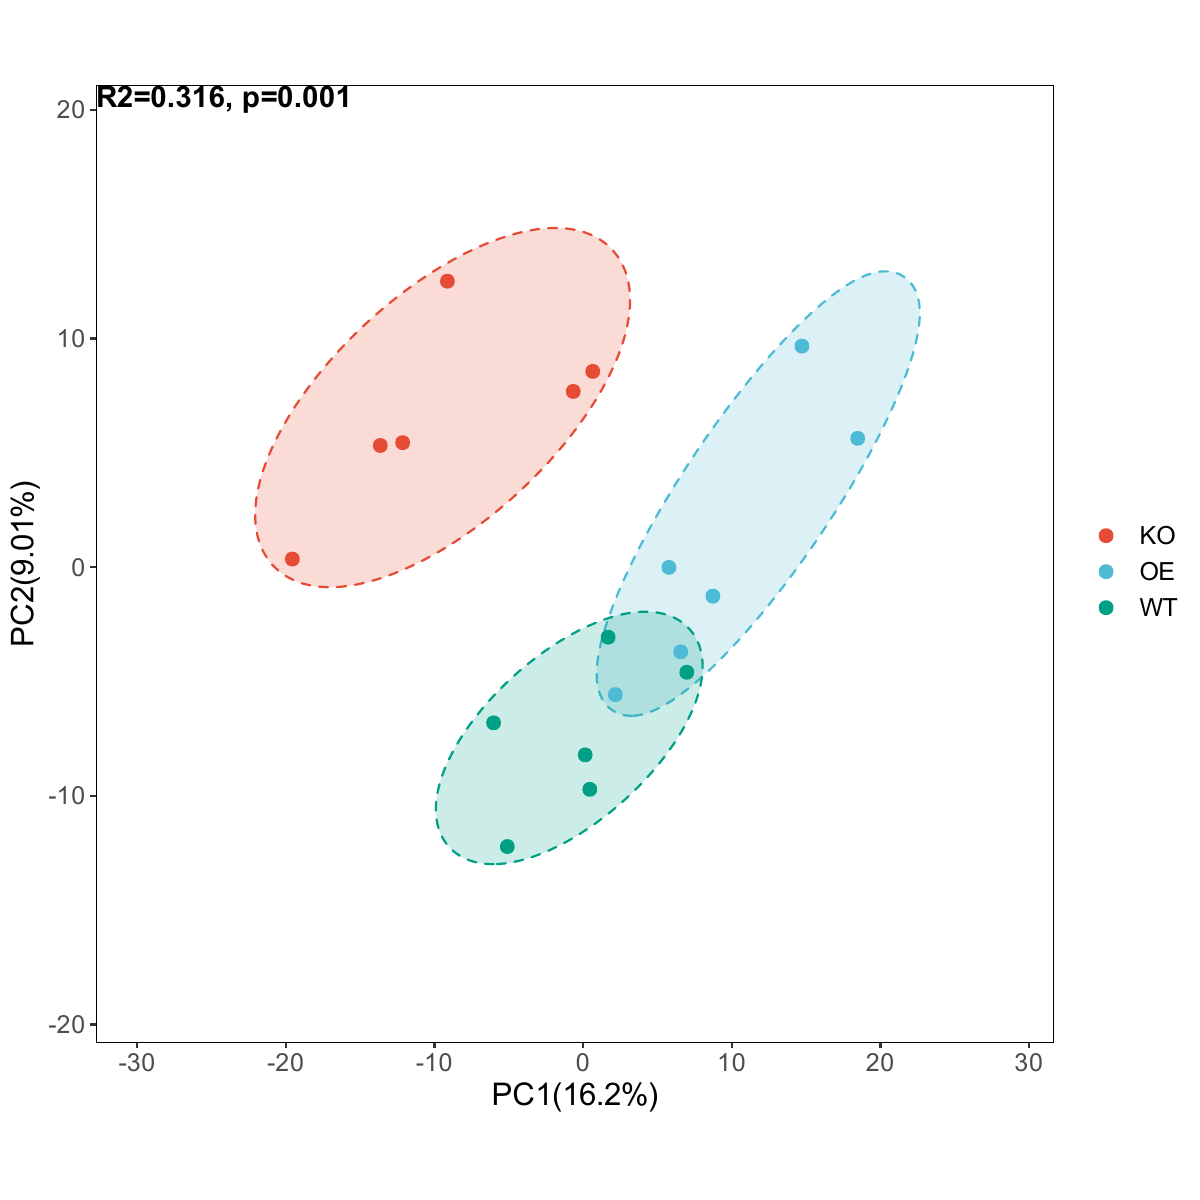
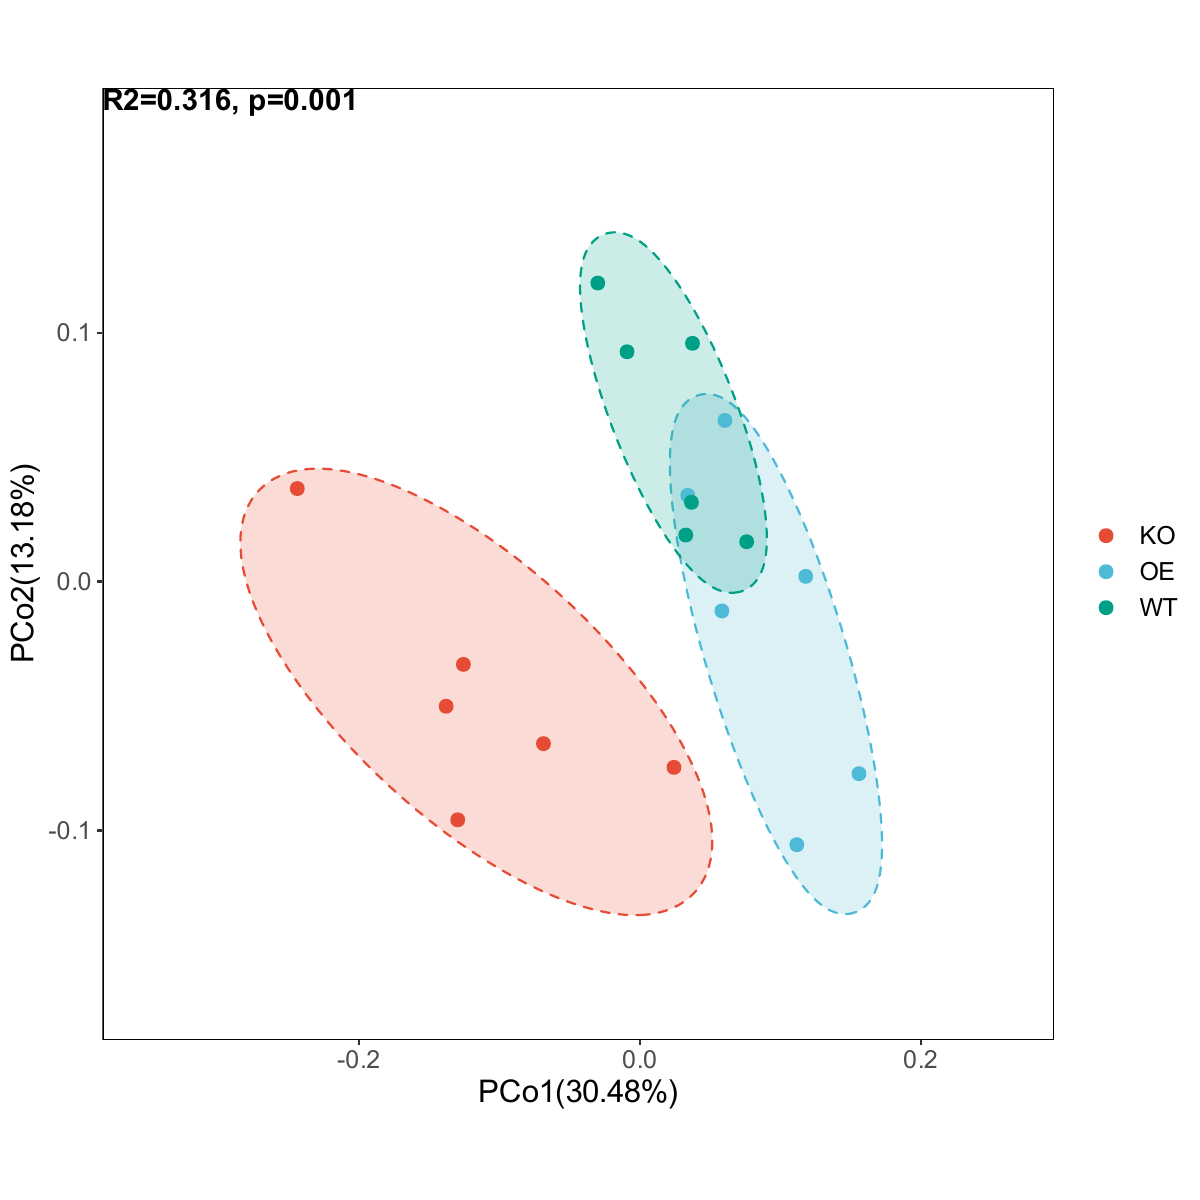
| Beta Diversity | Inter-sample distance matrices (Bray-Curtis / Jaccard / UniFrac); UPGMA hierarchical clustering; PCA / PCoA / NMDS ordination; ANOSIM / adonis intergroup tests | Distance-matrix heatmap, clustering tree, PCA / PCoA / NMDS plots |
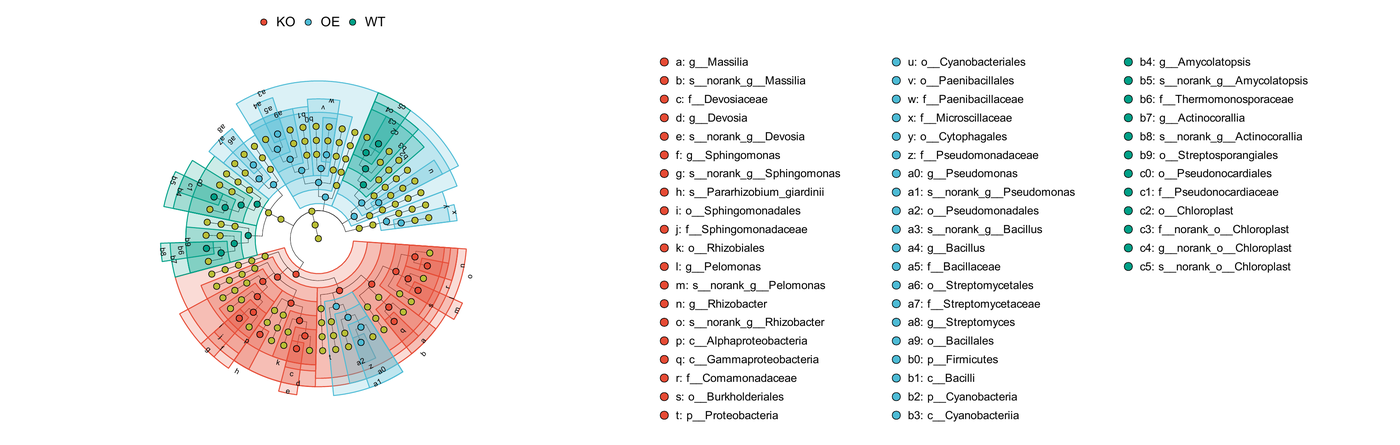
| Differential Taxa Analysis | LEfSe linear discriminant analysis effect size (LDA scores); Wilcoxon rank-sum test for two groups and Kruskal test for multiple groups to identify significantly enriched taxa | LEfSe cladogram, LDA bar chart, differential test tables |
| Functional Prediction | PICRUSt2 prediction of functional abundance from marker genes (KEGG orthologs KO, EC classes); PCoA of functional units; LEfSe and MetagenomeSeq differential analysis of KEGG / MetaCyc pathways | Functional abundance tables, functional PCoA plot, pathway LEfSe plots |
무상 연구 설계 · 밀착 실행 · 심층 데이터 해석


납기 안내: 시료 운송, 통관 신고 등의 사유로 납기가 연장될 수 있으며, 실제 프로젝트 일정을 기준으로 합니다.
요청을 남겨주시면 1영업일 이내에 회신드립니다 (무료 검토)
Free study design · Interactive execution · In-depth data interpretation