| Item | Details |
|---|---|
| Library Prep | Oligo(dT) bead-based mRNA enrichment |
| Read Alignment | STAR aligns cleaned reads to the reference genome; sequencing and library quality assessed by mapping rate, insert size and coverage uniformity |
| Quantification | Gene/transcript quantification against the annotation, outputting Count, FPKM, TPM and log2TPM |
| DE Thresholds | Read-count normalization (depth correction) → statistical modeling for P values → BH adjustment (padj); default |log2(FoldChange)| > 1 and padj < 0.05 |
| Standard Delivery | Raw data + analysis report |
| Module | Core Methods & Metrics | Key Outputs |
|---|---|---|
| Sequencing Statistics | Base-quality and content distributions of raw fastq (R1/R2); 3′/5′ adapter trimming; filtering reads with mean quality < 20 or length < 50 bp and reads containing N; rRNA contamination rate assessment | Raw and cleaned data statistics tables, base-quality and content distribution plots |
| Alignment QC | STAR aligns cleaned reads to the reference genome; sequencing and library quality assessed at checkpoints including mapping rate, insert size and coverage uniformity | Mapping-rate statistics tables, per-sample alignment detail plots |
| mRNA Quantification | Gene/transcript quantification against the annotation with Count, FPKM, TPM and log2TPM outputs; Top-10 highly expressed transcripts summarized | Expression matrices, Top-10 expression tables |
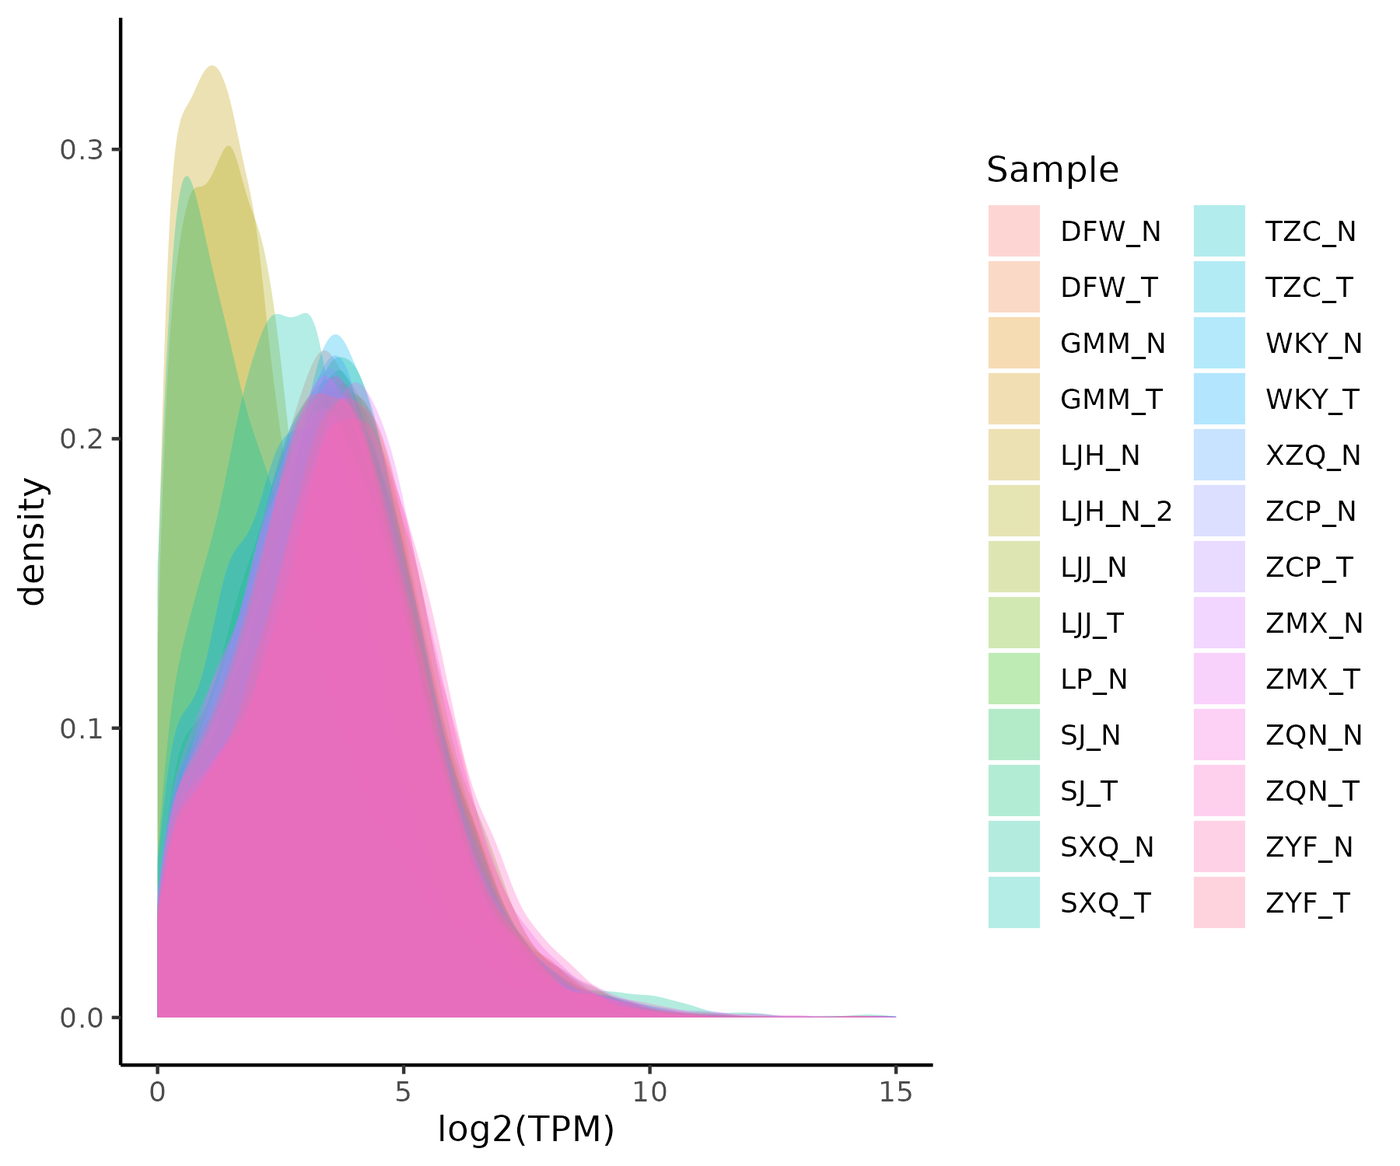
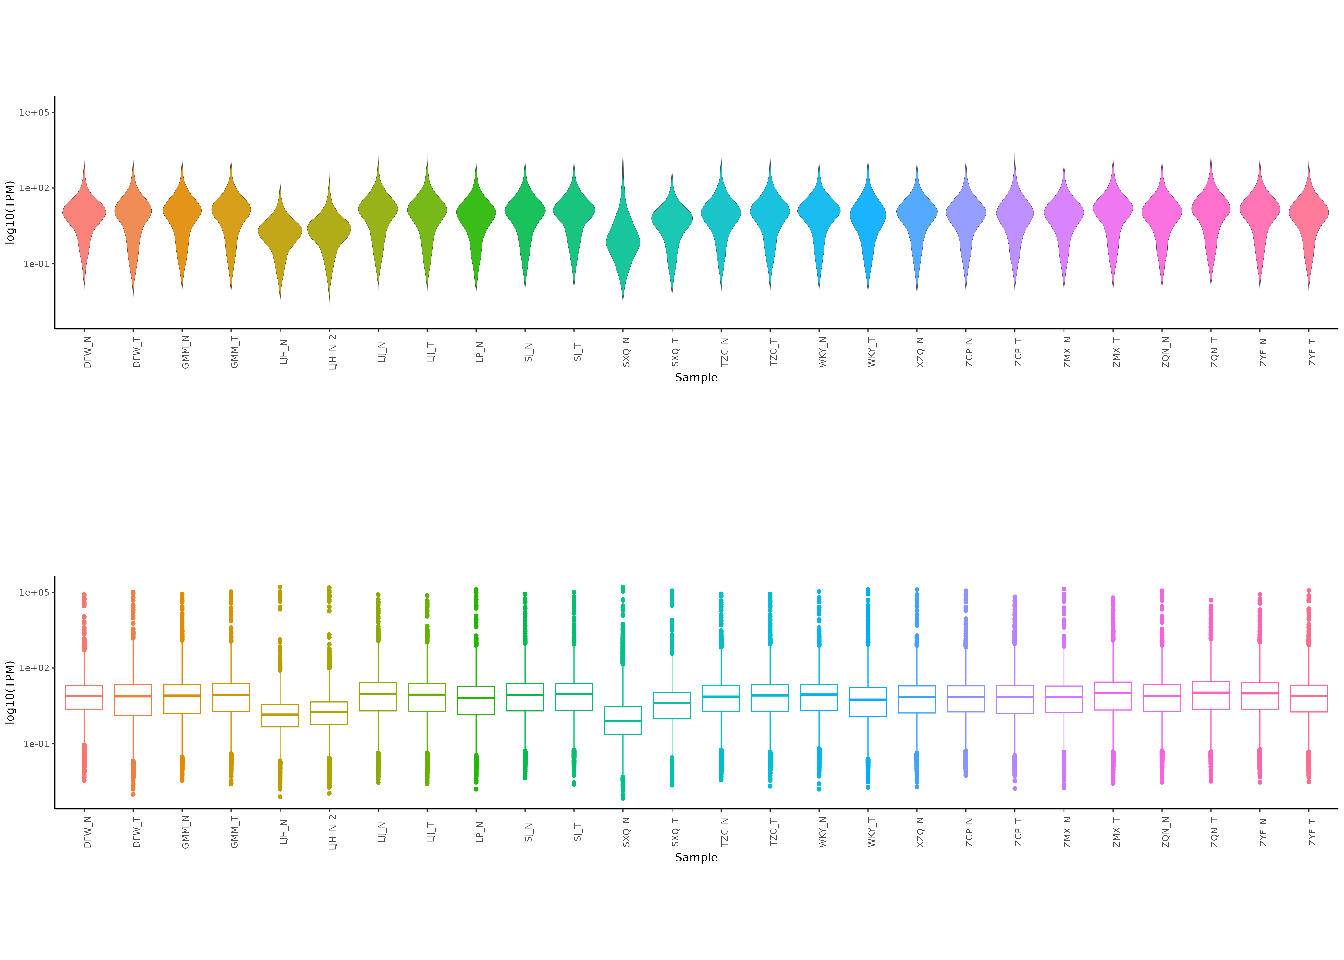
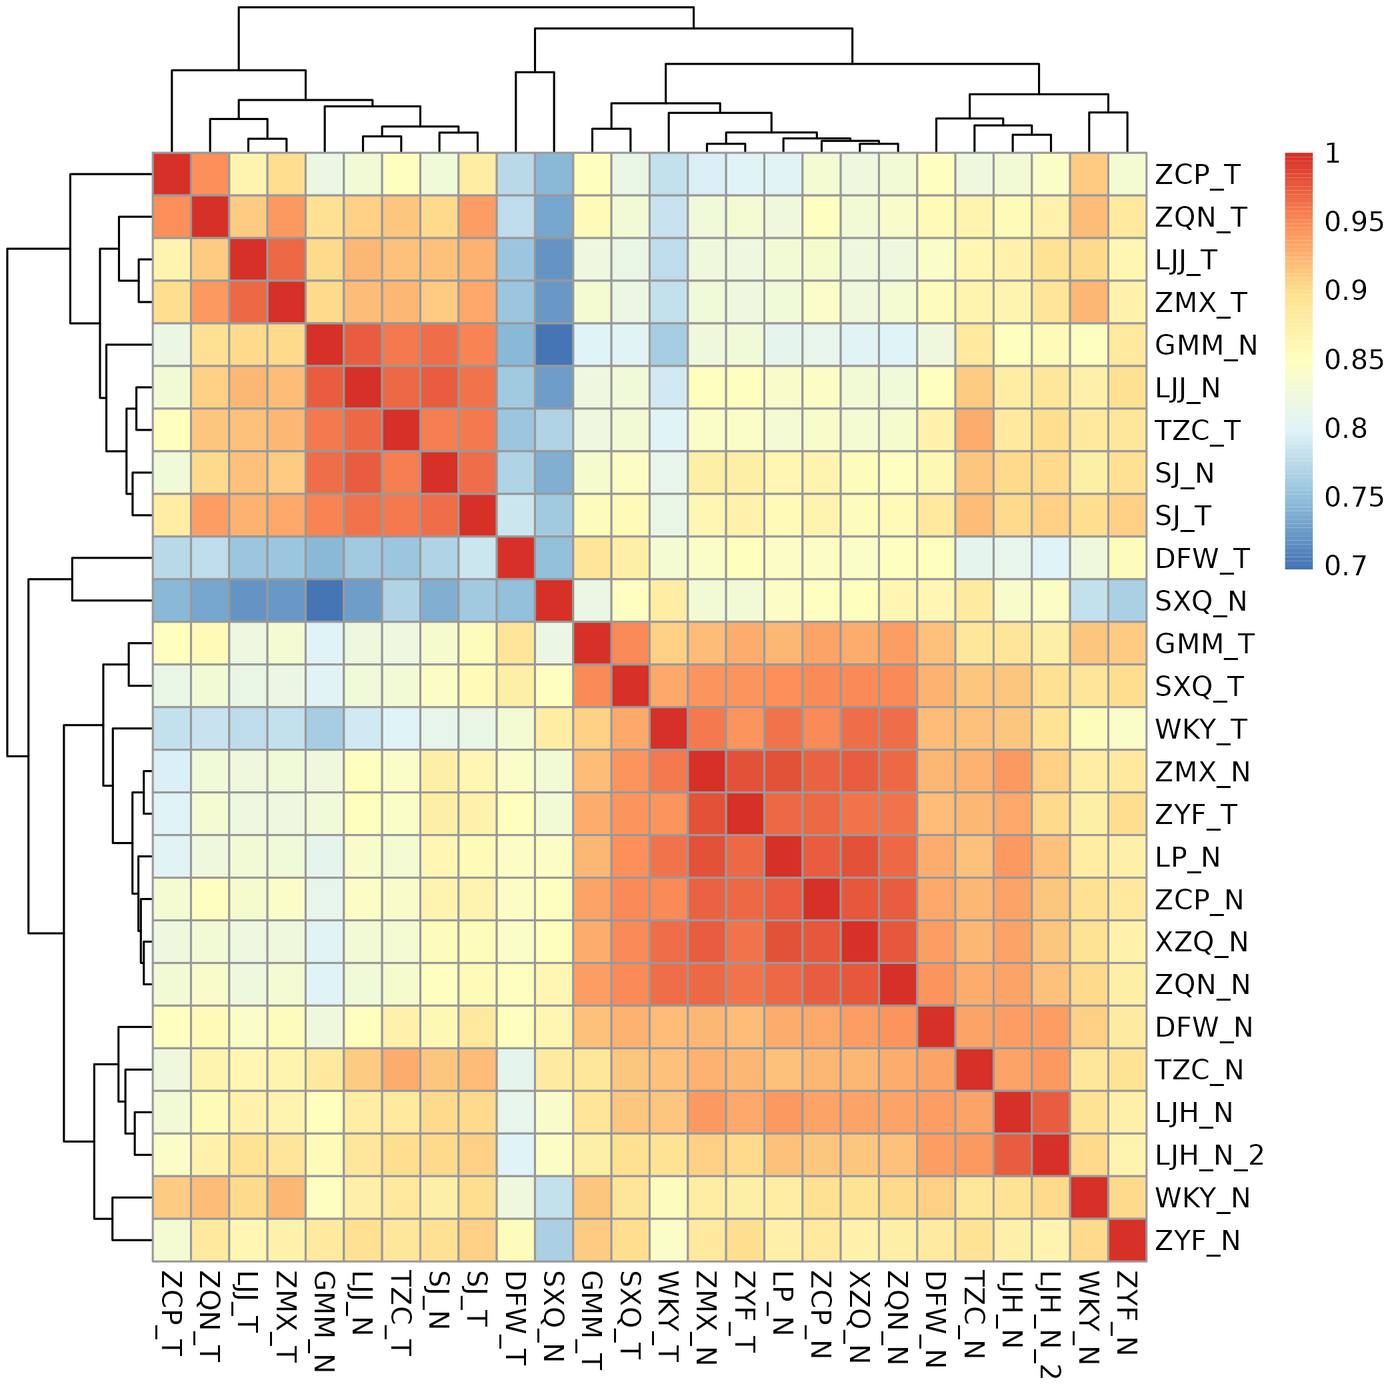
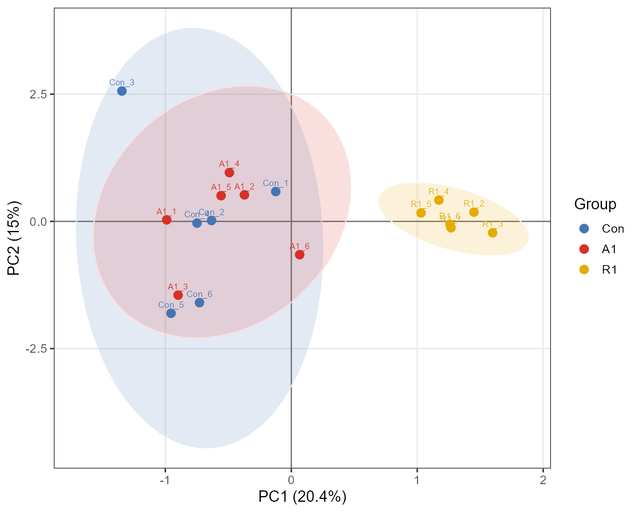
| Expression Distribution & QC | Expression density distributions; per-sample violin/box plots; inter-sample Pearson correlation heatmaps (ideal within-group R² > 0.9) and PCA | Density plots, violin/box plots, correlation heatmaps, PCA plots |
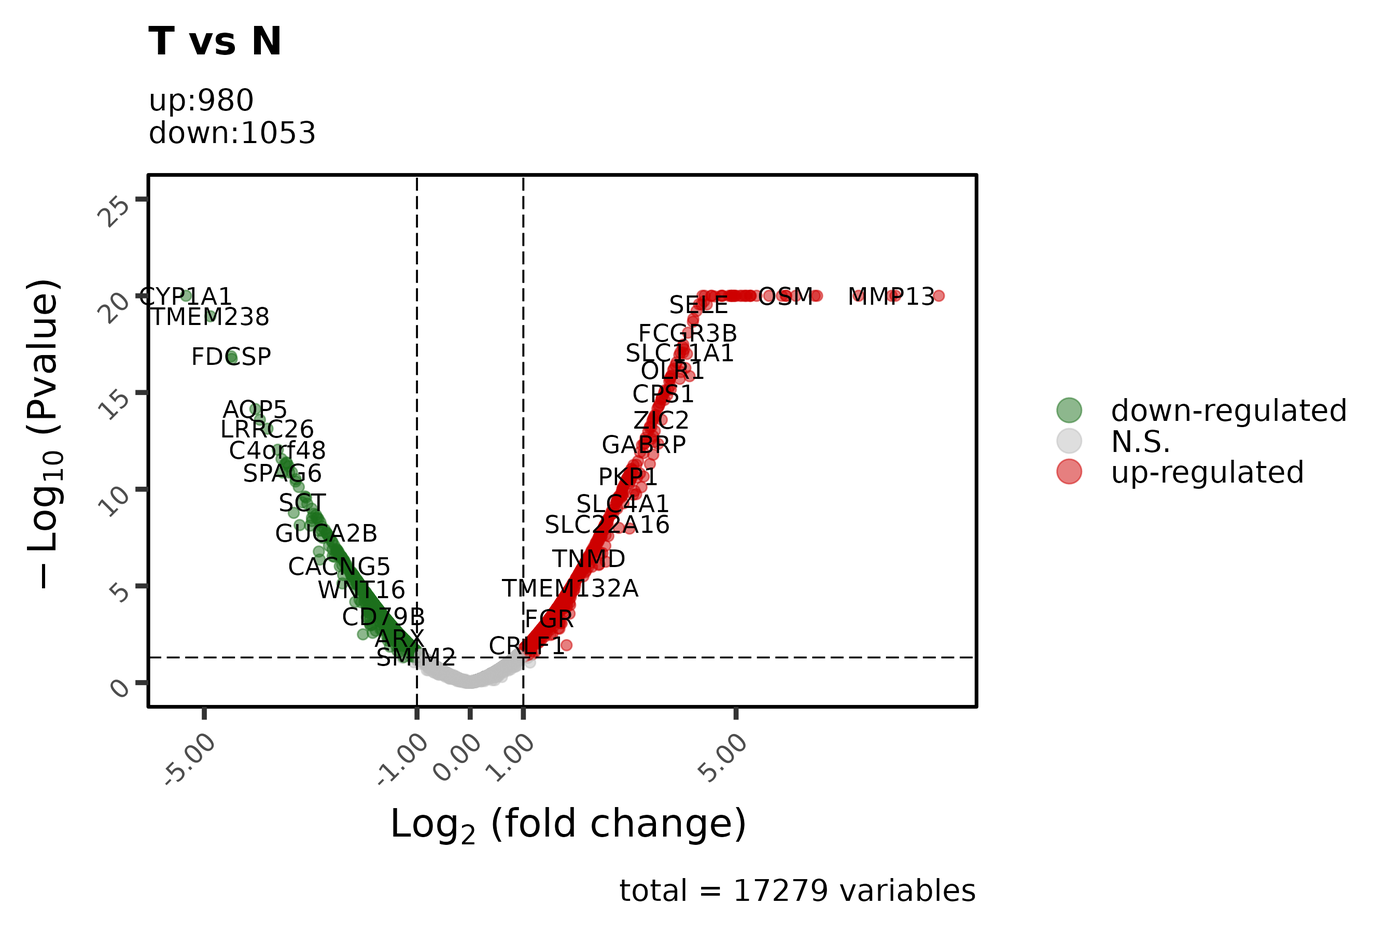
| Differential Analysis | Read-count normalization (depth correction) → statistical modeling for P values → BH multiple-testing adjustment (padj); default |log2(FoldChange)| > 1 and padj < 0.05 | Differential analysis result tables, volcano plots |
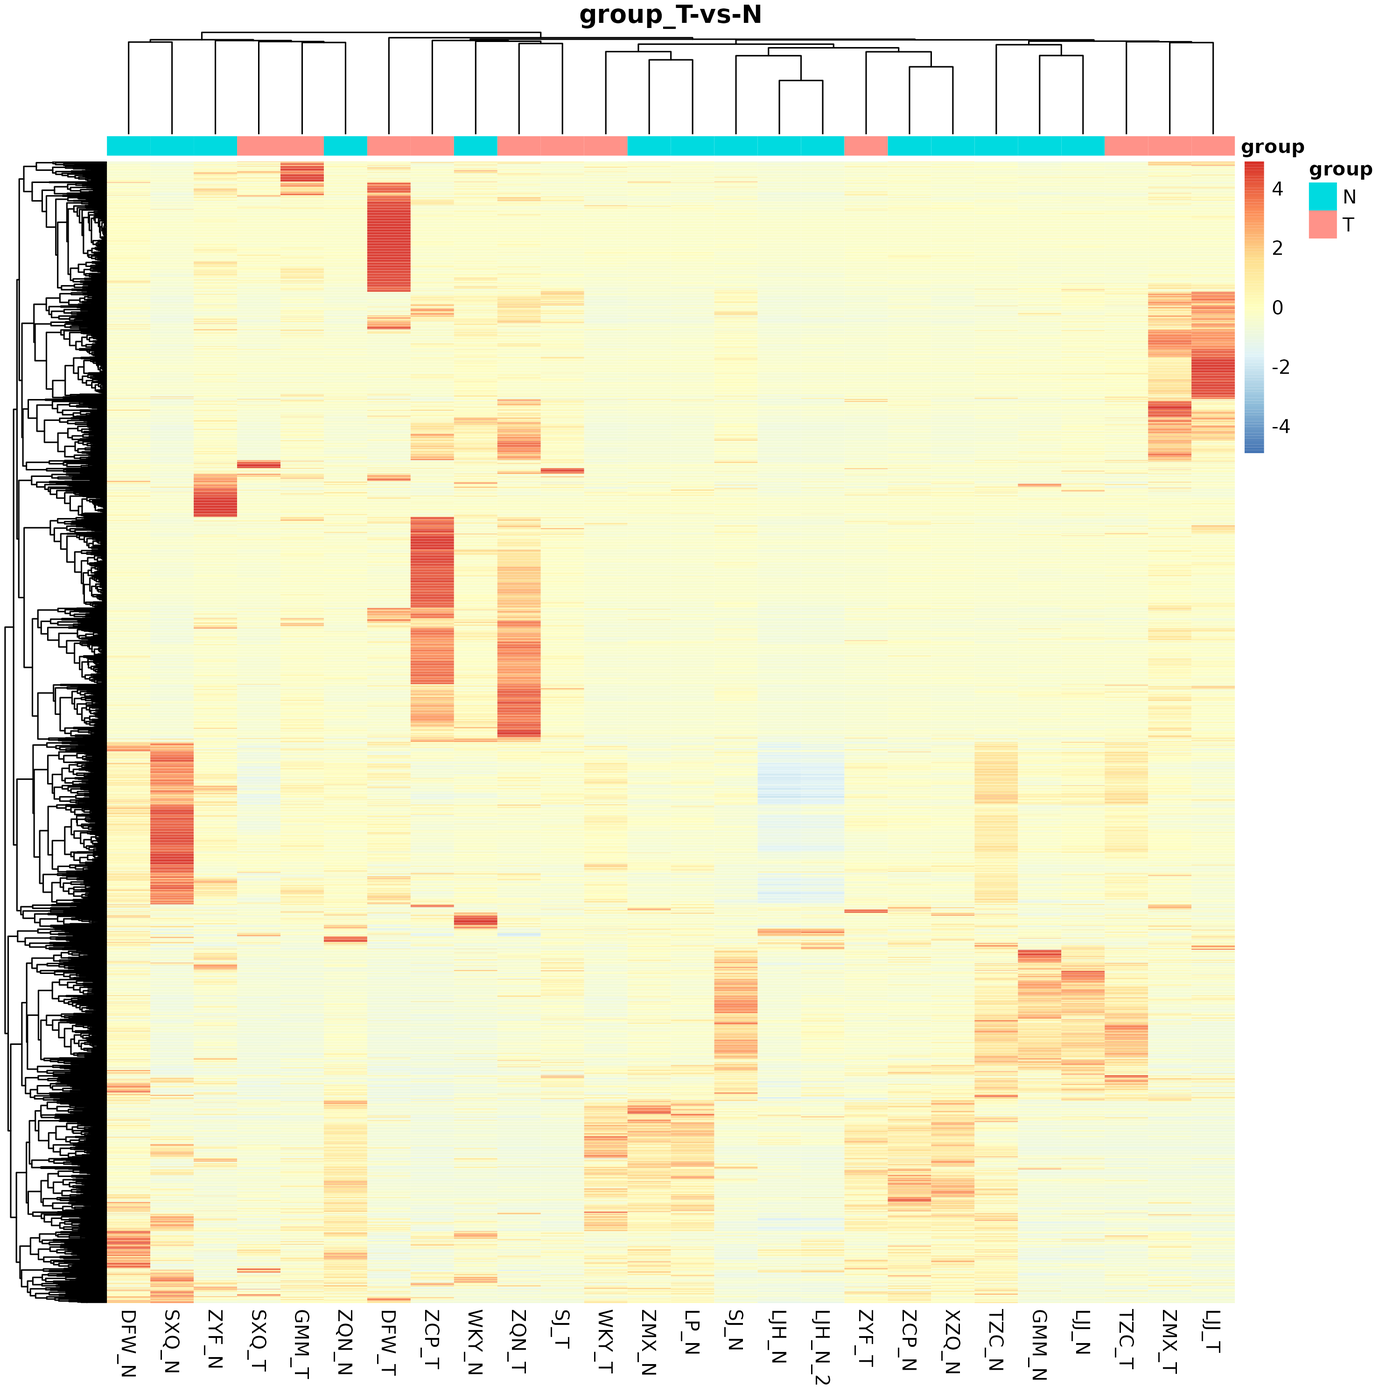
| DE Patterns | Expression-pattern clustering of differential genes; shared and unique DEG statistics across multiple comparisons | Pattern-clustering heatmaps, shared-DEG diagrams |
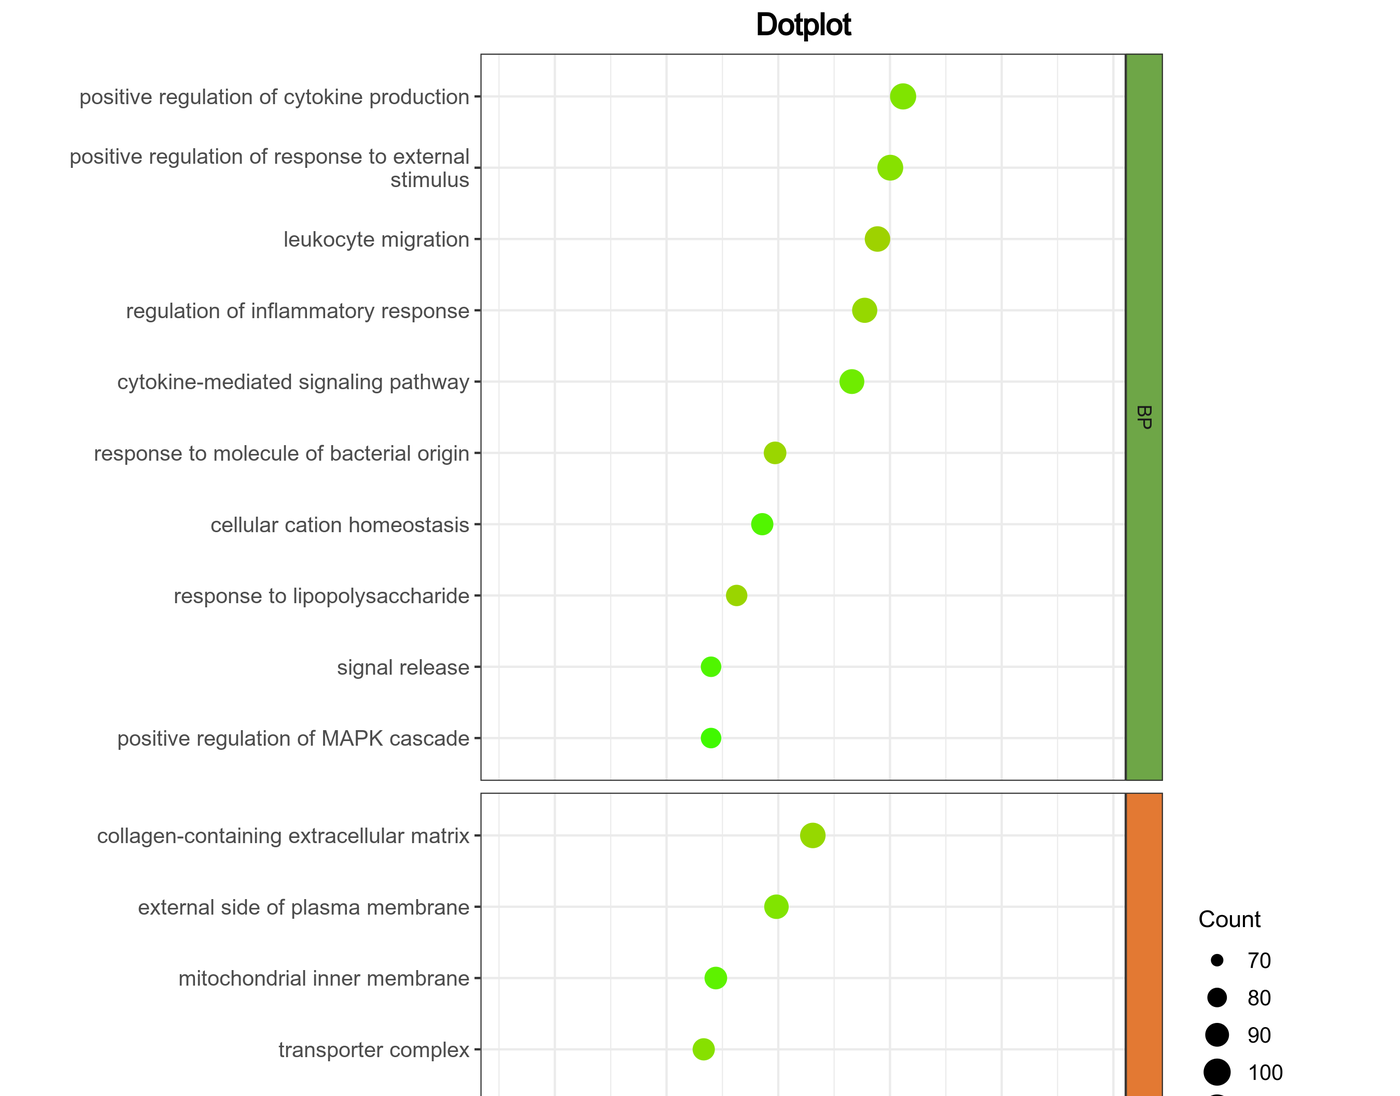
| GO Functional Enrichment | GO enrichment of DEGs (BP / CC / MF), reporting GeneRatio / BgRatio, enrichment factor and adjusted p-values | GO enrichment bubble and bar plots |
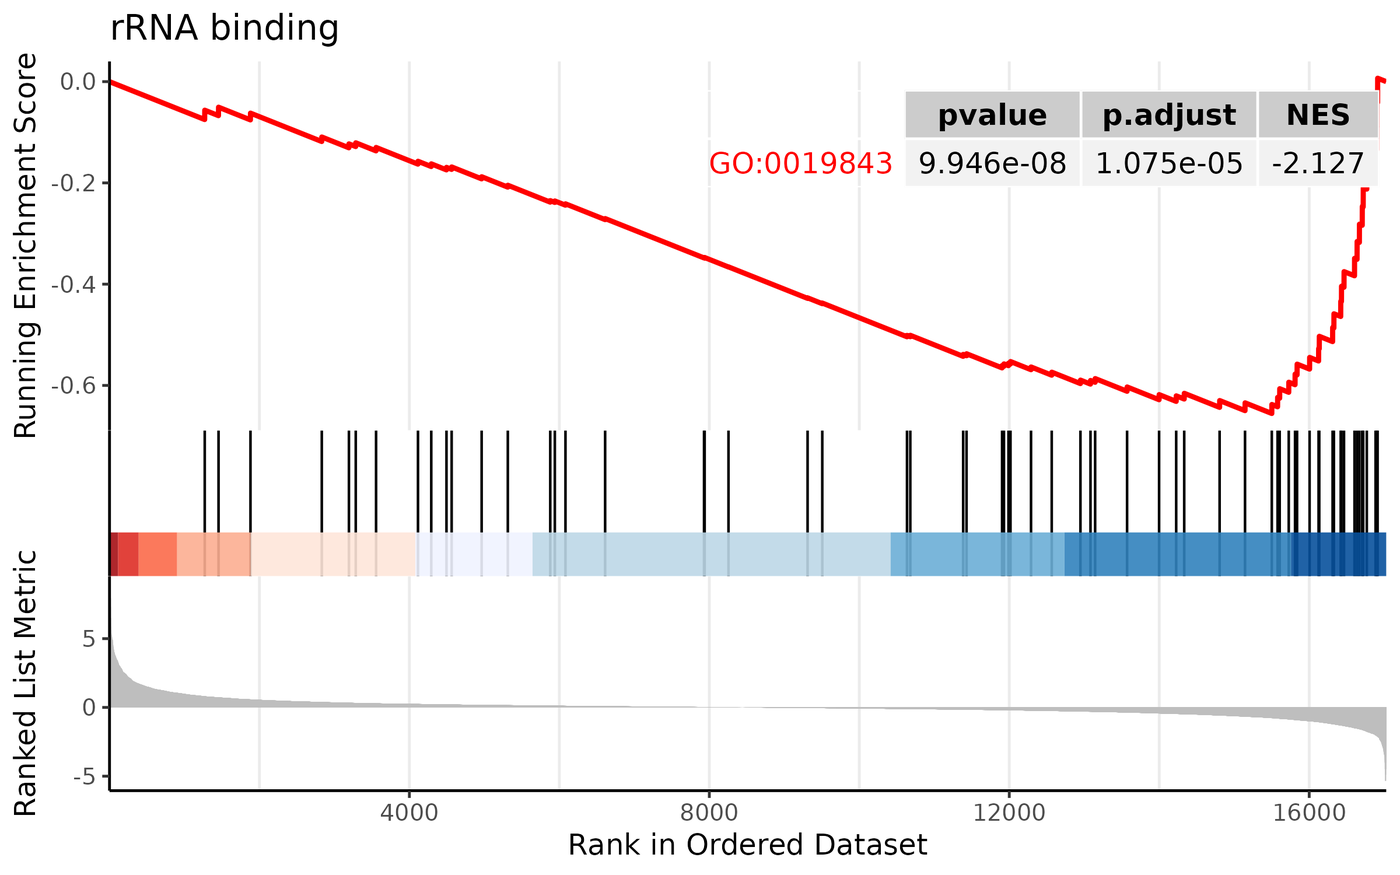
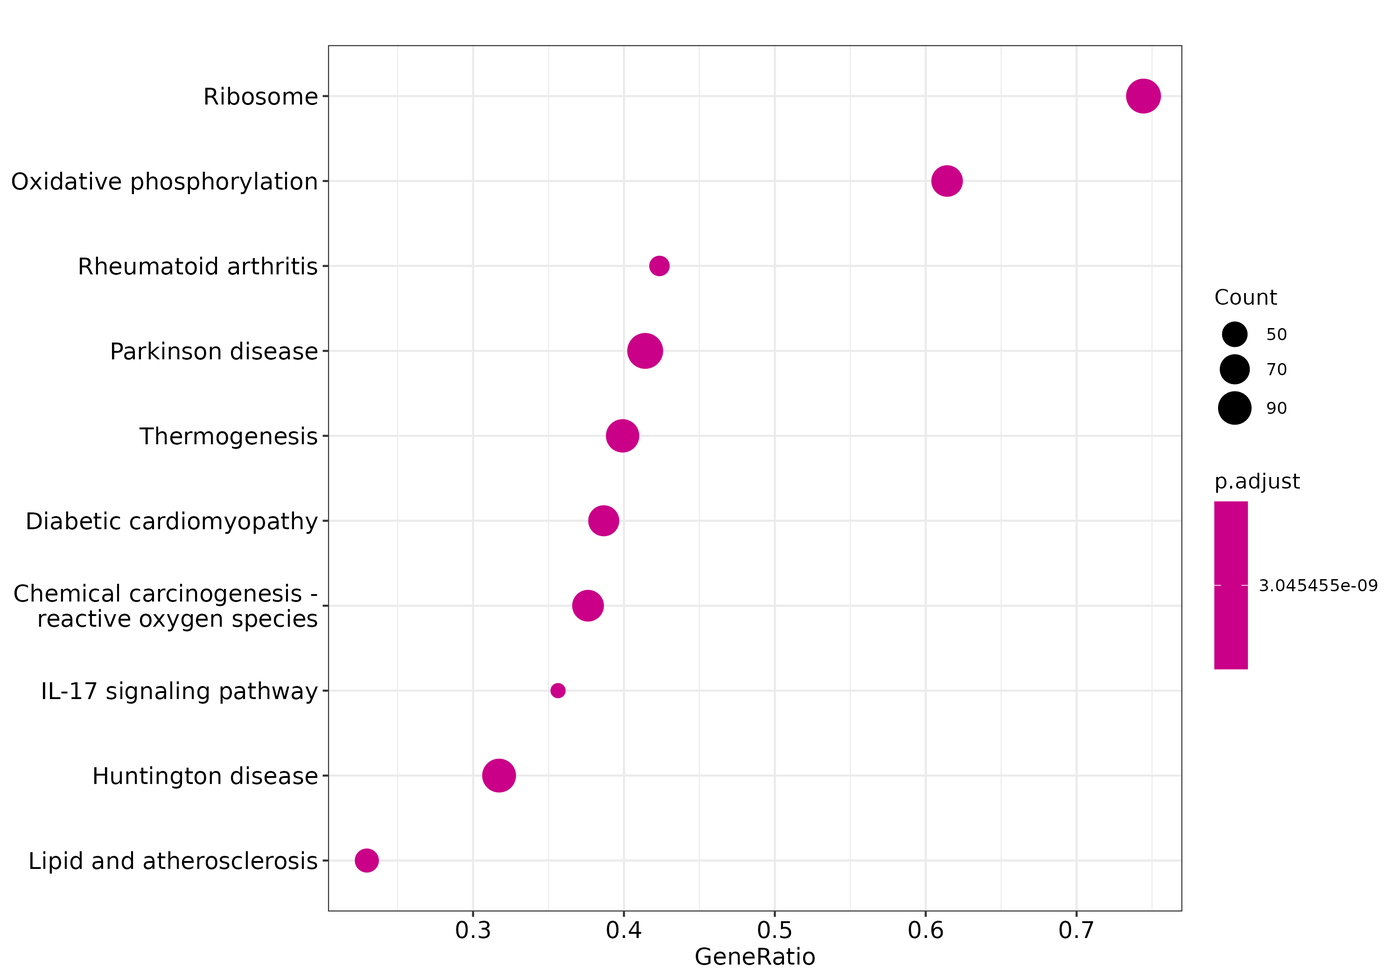
| KEGG & GSEA | KEGG pathway enrichment of DEGs; GSEA based on GO and KEGG gene sets, reporting ES, NES and adjusted p-values | KEGG enrichment plots, GSEA enrichment plots and dot plots |
무상 연구 설계 · 밀착 실행 · 심층 데이터 해석


납기 안내: 시료 운송, 통관 신고 등의 사유로 납기가 연장될 수 있으며, 실제 프로젝트 일정을 기준으로 합니다.
요청을 남겨주시면 1영업일 이내에 회신드립니다 (무료 검토)
Free study design · Interactive execution · In-depth data interpretation