| Item | Details |
|---|---|
| Sequencing Data Volume | 6 G / 10G |
| Assembly | Assembly into contigs with MEGAHIT (succinct de Bruijn graph); N50, contig counts and length distributions reported |
| Gene Prediction | Prodigal predicts prokaryotic and metagenomic ORFs, outputting gene sequences, protein sequences and GFF files |
| Non-redundant Gene Set | MMseqs2 clustering at 95% identity and 90% alignment coverage for dereplication; gene abundance quantified by Bowtie2 mapping |
| Taxonomic & Functional Annotation | Taxonomic annotation by DIAMOND against NCBI-NR; functional annotation across five databases — GO, KEGG, COG, CAZy and CARD (including antibiotic resistance ontology ARO) |
| Module | Core Methods & Metrics | Key Outputs |
|---|---|---|
| Sequencing Statistics | Raw fastq (R1/R2) statistics: data volume, read counts, base counts, Q20/Q30 and GC content; base retention rate after adapter trimming and quality filtering | Raw and cleaned data statistics tables, base-quality and content distribution plots |
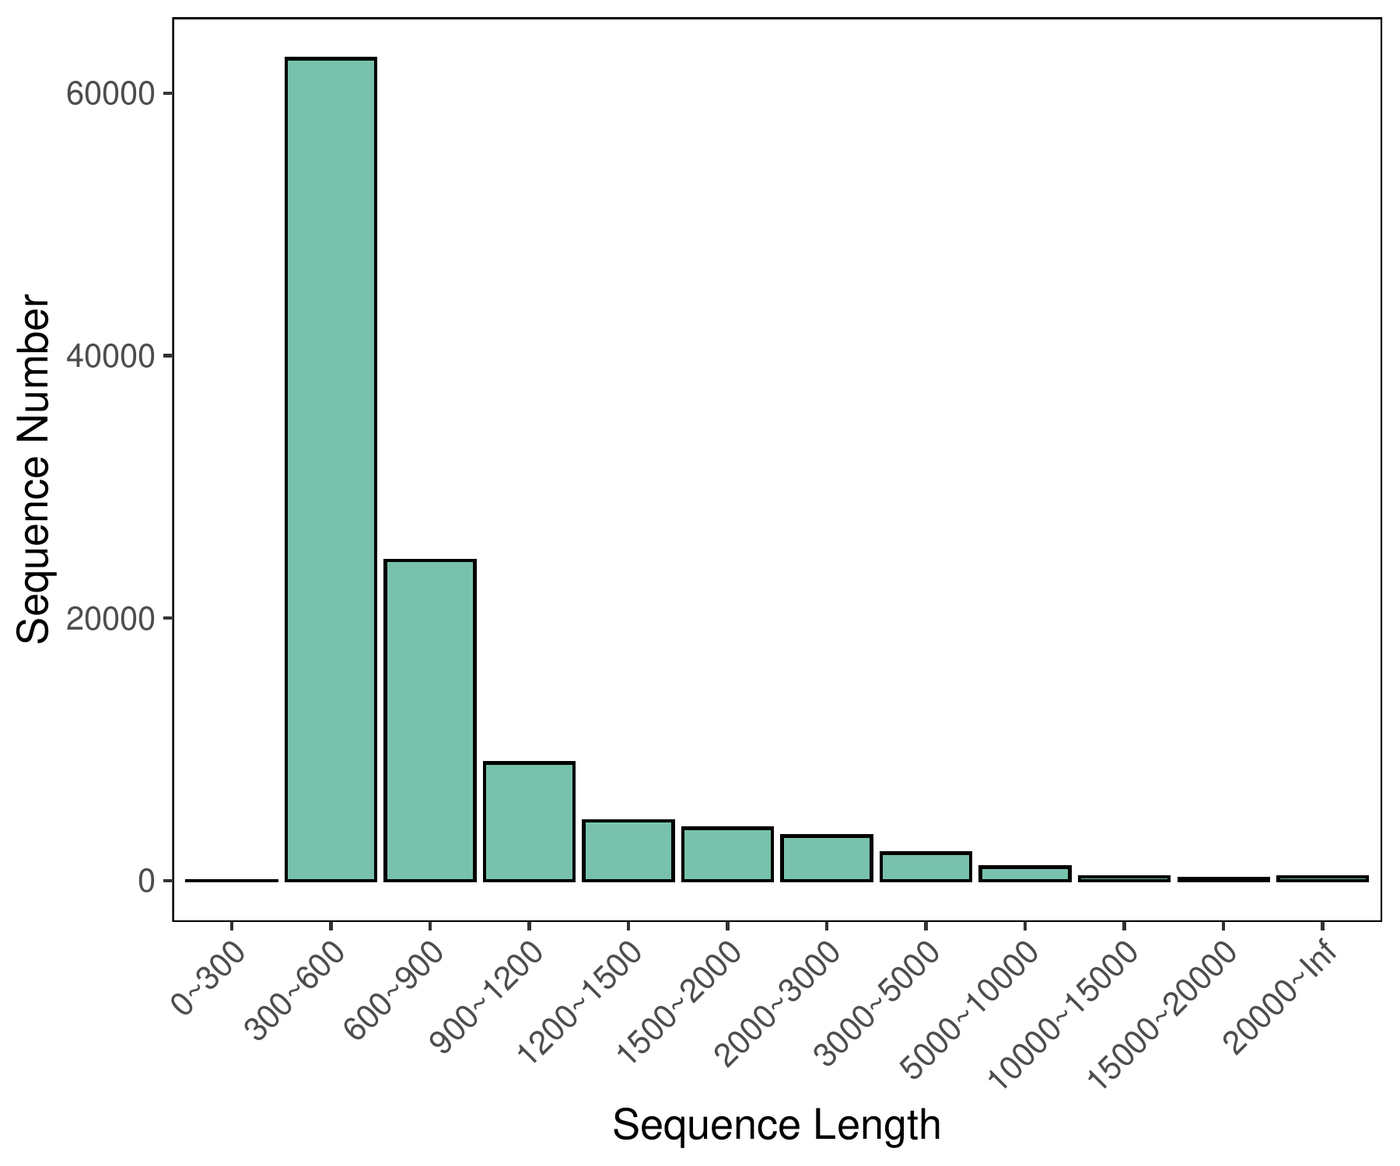
| Assembly | MEGAHIT (succinct de Bruijn graph) assembles effective sequences per sample into contigs; N50, contig counts and length distributions reported | Assembly statistics tables, length distribution plots |
| Gene Prediction | Prodigal predicts prokaryotic and metagenomic ORFs and coding regions, outputting gene sequences, protein sequences and GFF files | Gene sequence files, protein sequence files, GFF |
| Non-redundant Gene Set | MMseqs2 clustering at 95% identity and 90% alignment coverage for dereplication; per-sample effective reads mapped to the gene set with Bowtie2 for abundance | Non-redundant gene set, gene abundance tables |
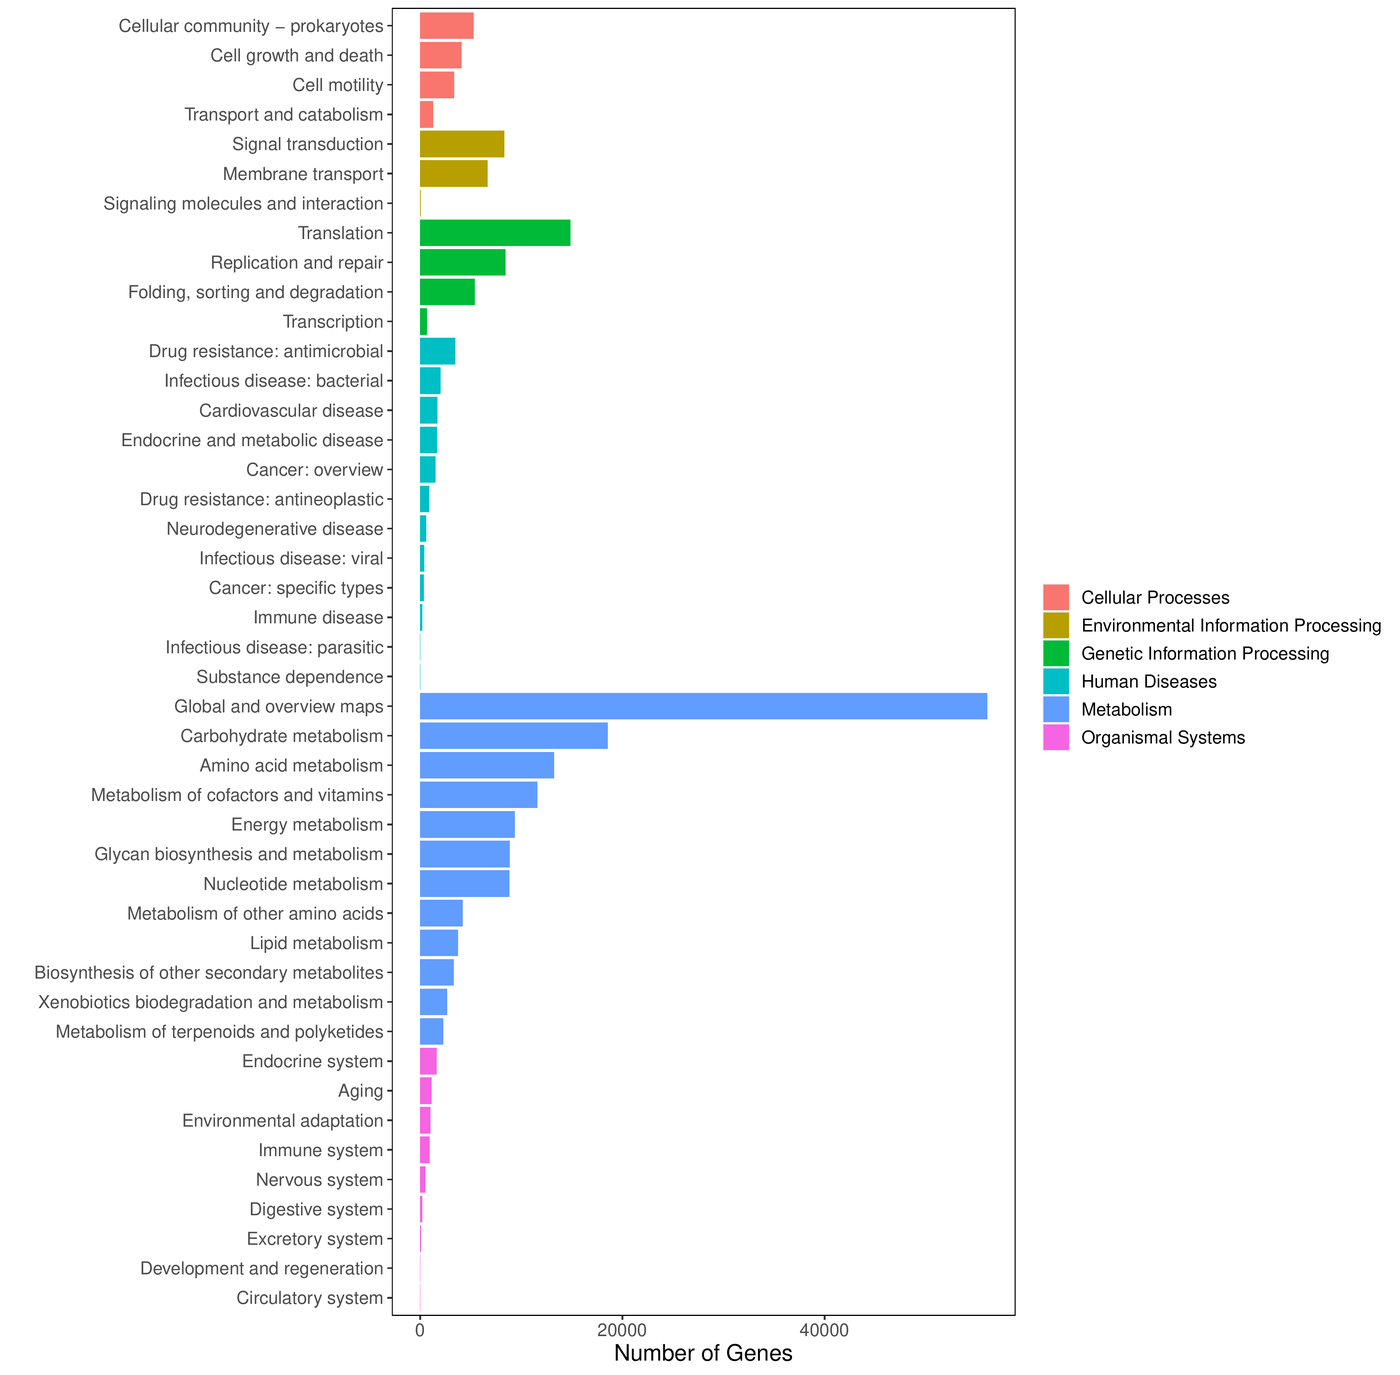
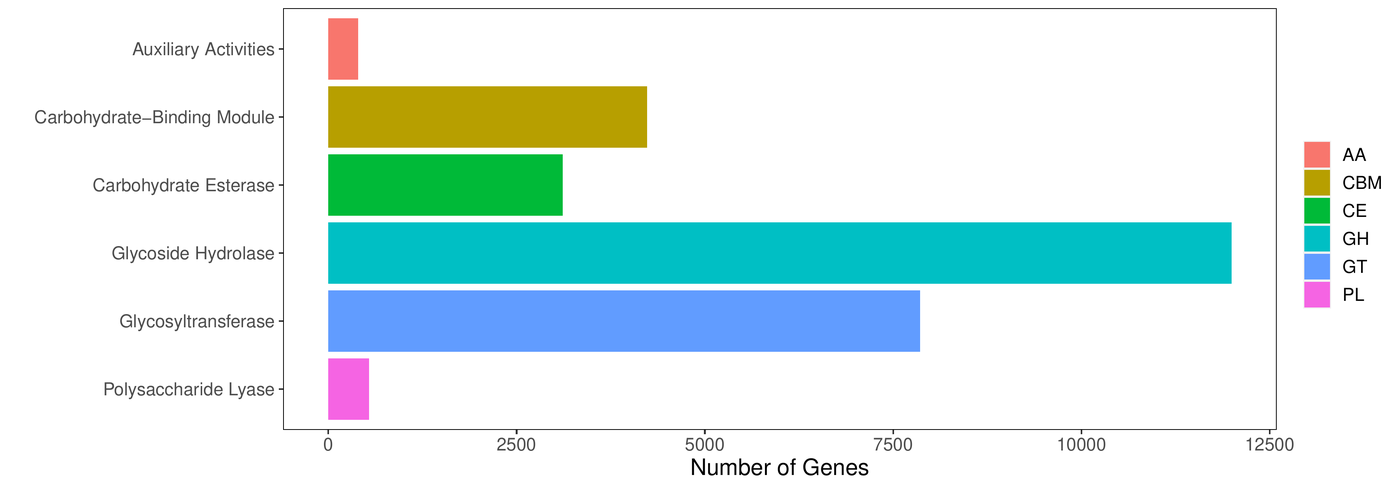
| Taxonomic & Functional Annotation | DIAMOND against NCBI-NR for taxonomic annotation with abundance computed from domain to species; functional annotation across GO, KEGG, COG, CAZy and CARD (including ARO) | Annotation summary tables, per-database level abundance tables |
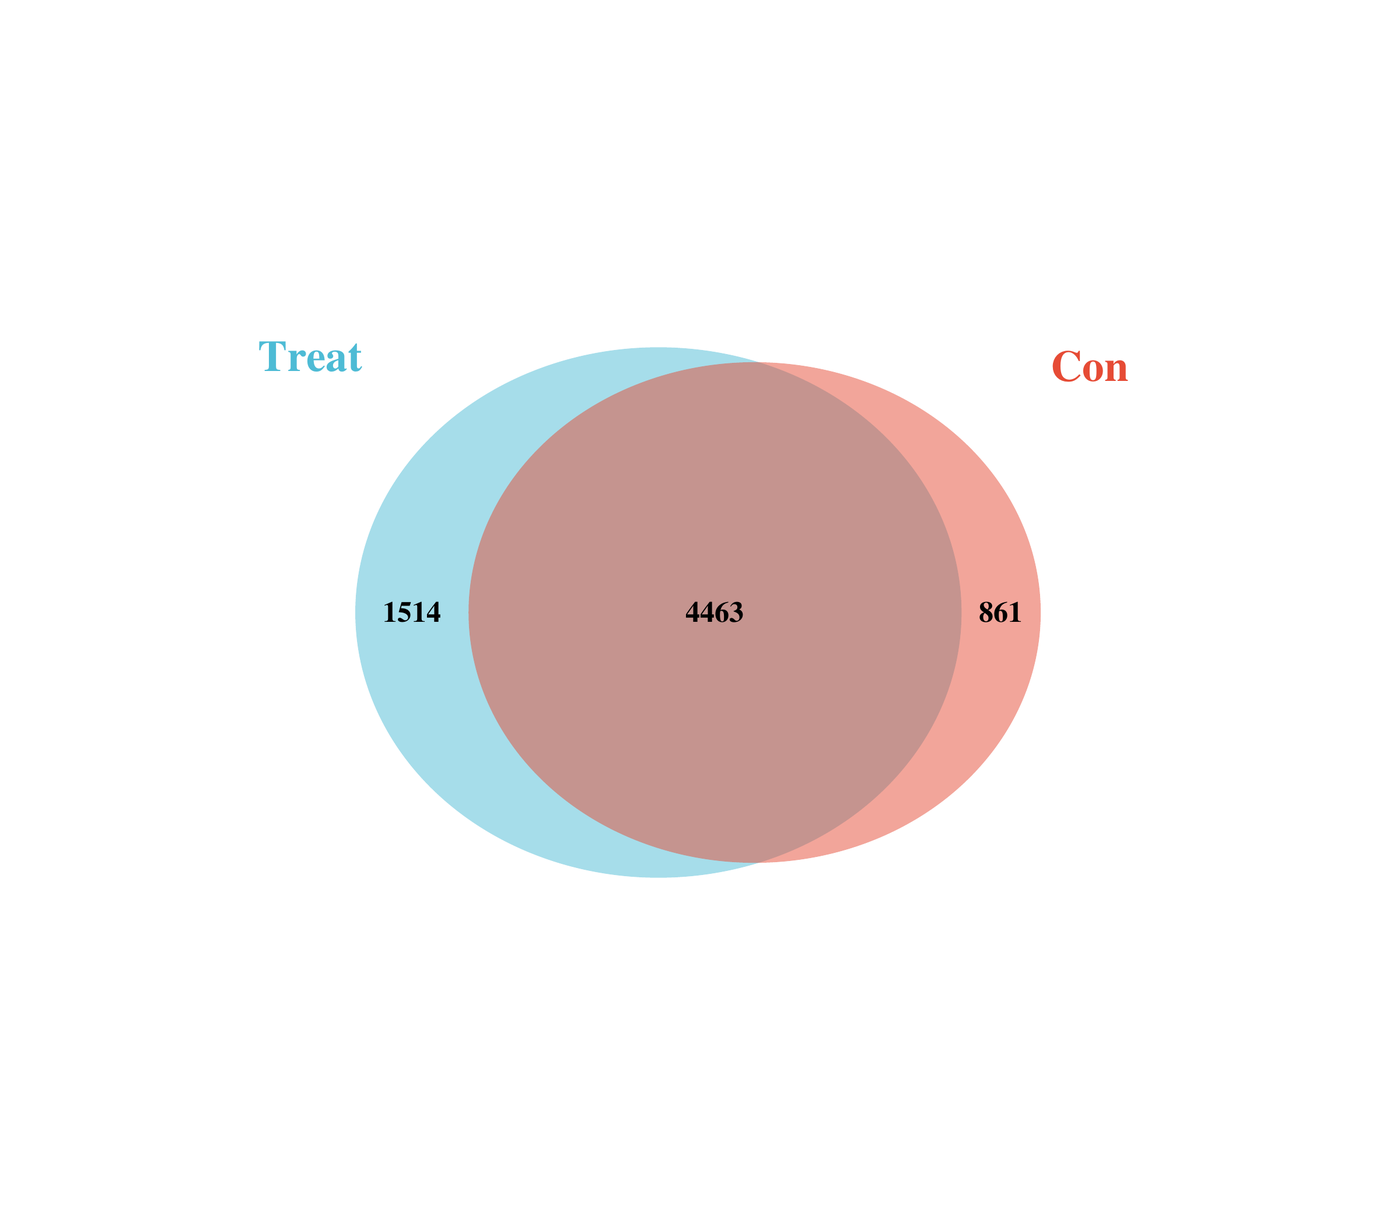
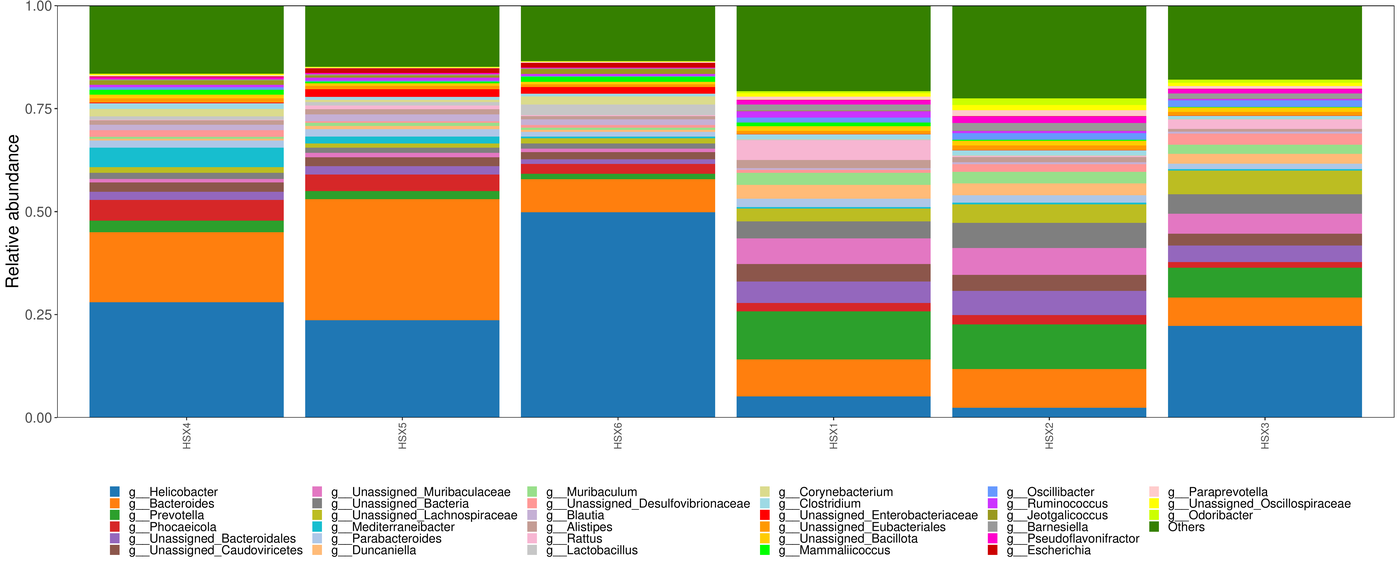
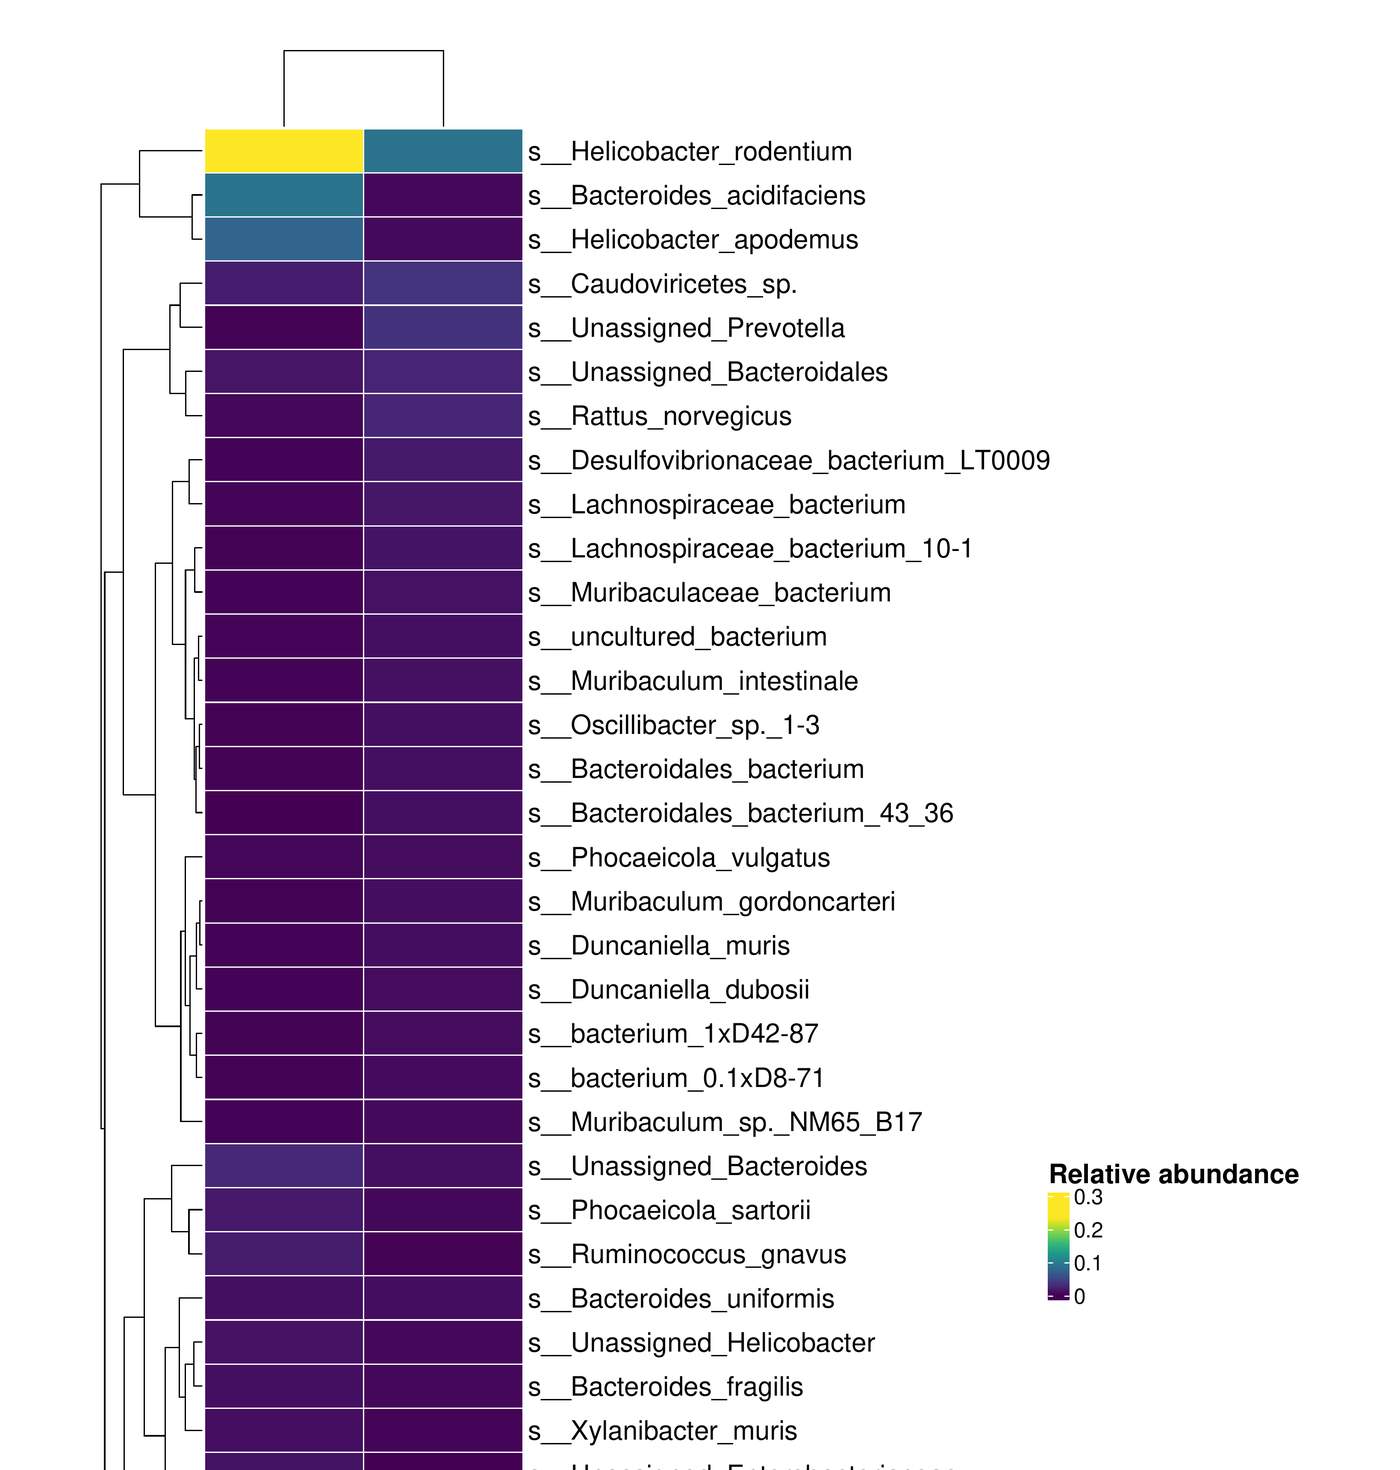
| Composition analysis | Venn diagrams, community bar plots and abundance heatmaps at species (Species/Genus/Family, etc.) and function (KO/COG/CAZy/ARO/GO/Pathway) levels | Venn diagram, community bar plots, heatmap |
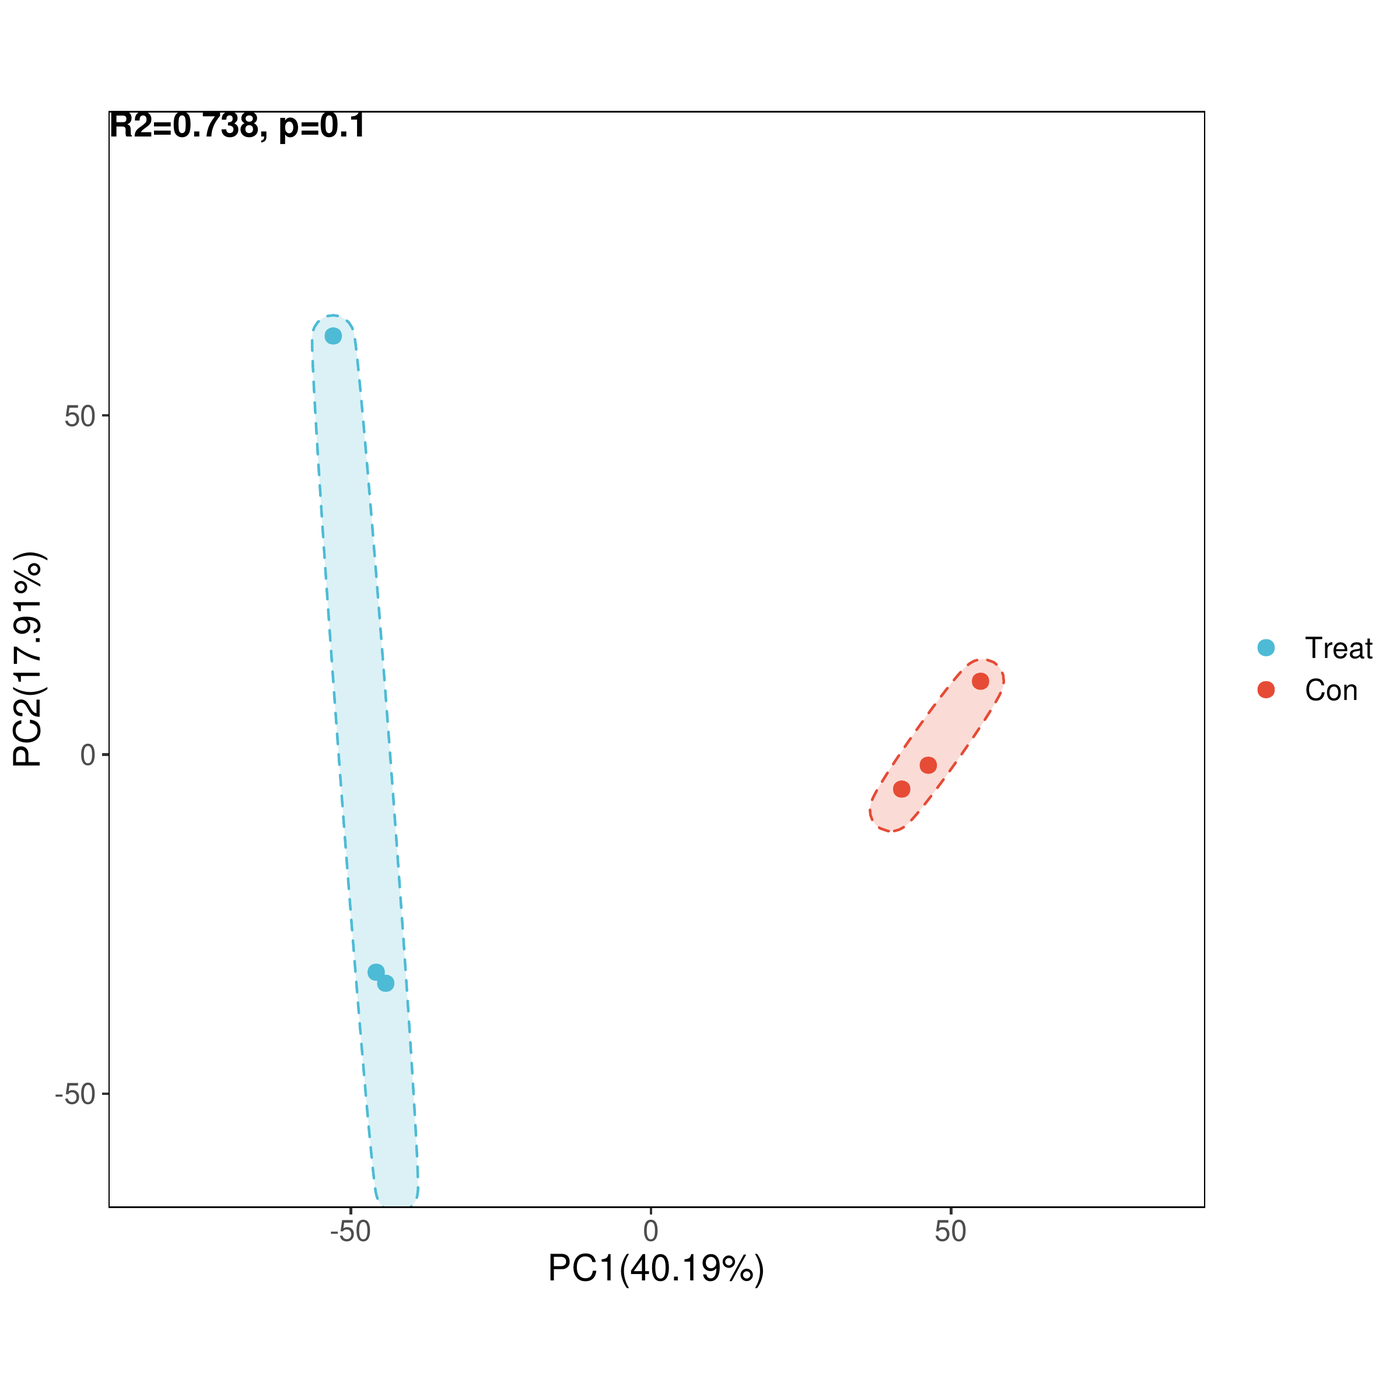
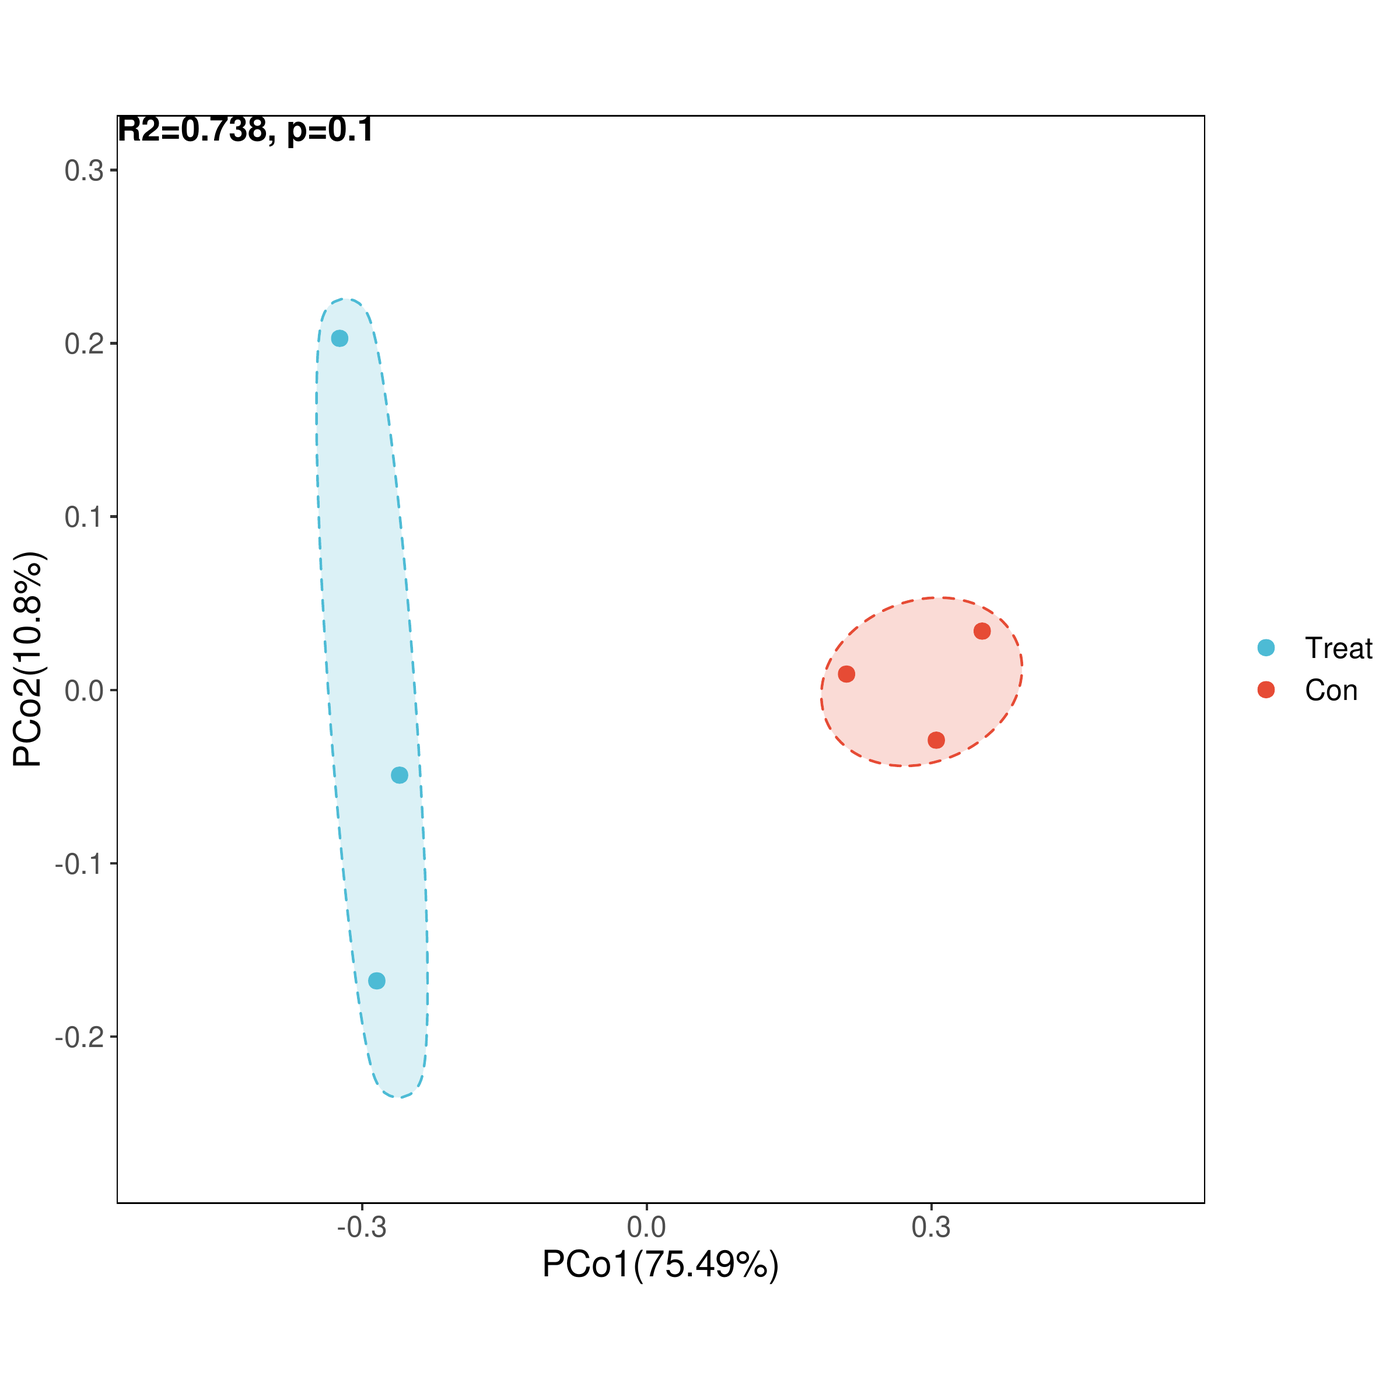
| Diversity analysis | Alpha-diversity indices with intergroup boxplots; beta-diversity distance matrices, hierarchical clustering, PCA / PCoA / NMDS ordination and ANOSIM tests | Index boxplots, PCA / PCoA / NMDS plots, ANOSIM plots |
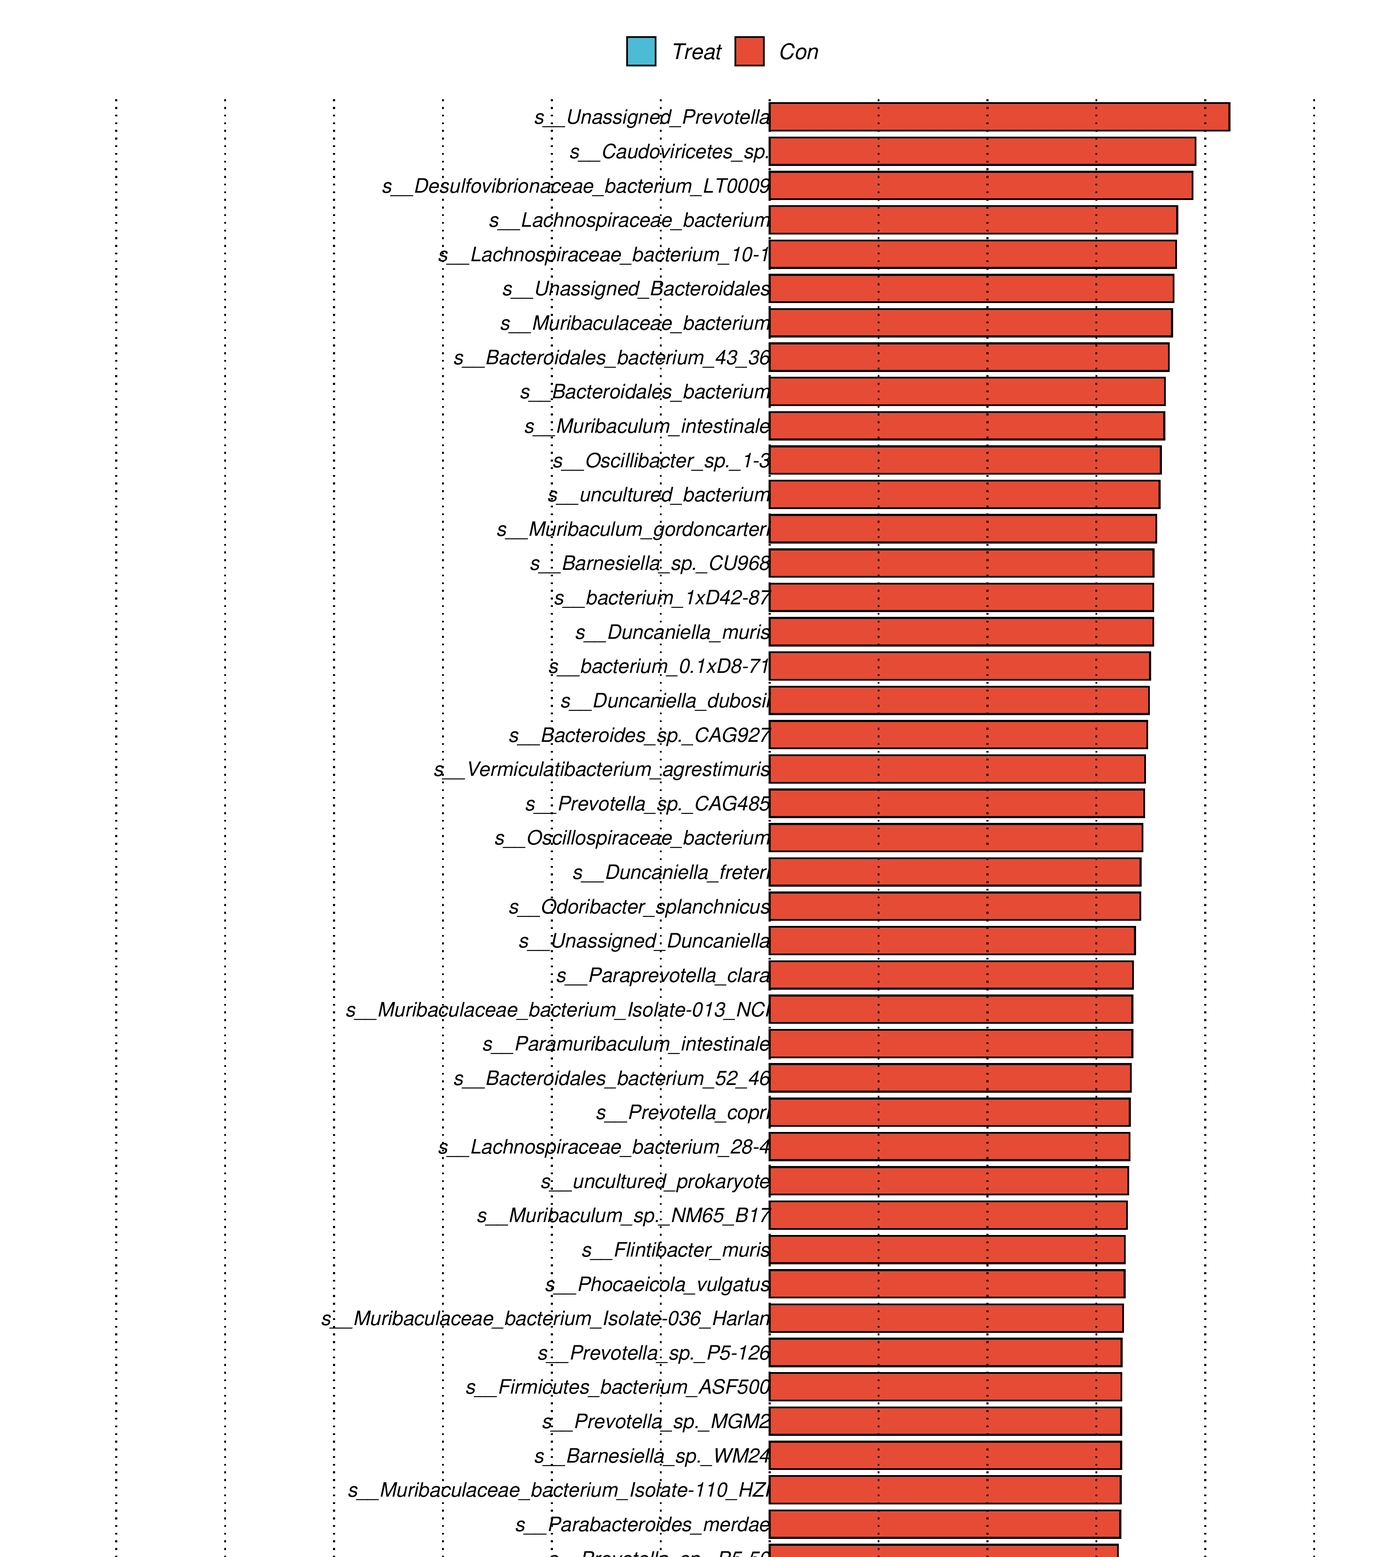
| Differential Analysis | LEfSe (LDA) at species and functional levels; intergroup Wilcoxon rank-sum tests to screen differential taxa and functional units | LEfSe plots, LDA bar charts, differential test tables |
무상 연구 설계 · 밀착 실행 · 심층 데이터 해석


납기 안내: 시료 운송, 통관 신고 등의 사유로 납기가 연장될 수 있으며, 실제 프로젝트 일정을 기준으로 합니다.
요청을 남겨주시면 1영업일 이내에 회신드립니다 (무료 검토)
Free study design · Interactive execution · In-depth data interpretation